What the UK public thinks about AI

Executive Summary 
The British public has already made up its mind on AI. The question is whether anyone in power is paying attention.
“It’s for those people up there, it’s not for us.”
— Diane, a former teacher in Lancashire
Drawing on focus groups and a nationally representative survey of 2,774 UK adults, with additional samples of ethnic minority and battleground-constituency voters, and real-time testing of five policy messages, this report finds a public that has already formed strong views that are largely protective, broadly consistent across demographics, and increasingly shaping how people vote.
The British public overwhelmingly favours more active regulation of AI. When asked to choose between safety and economic opportunity across six policy trade-offs, independent oversight, digital sovereignty, copyright, child safety, digital ID, and NHS data access, they pick safety every time. Majorities of between three-to-one and seven-to-one chose a pro-regulation position on the four clearest trade-offs, while digital ID and NHS data sharing were close to balanced. 85% want stronger laws to make AI safe. Only 10% are confident in voluntary industry guidelines. Those who favour regulation are more likely to be politically active and more likely to vote than those who do not. This is a settled consensus waiting for the policy to catch up. (Sections 1 and 4)
The British public divides into six AI mindsets, and they reveal more than demographics do. Rather than sorting people by age or class, we segmented them by how they actually think and feel about AI: how concerned they are, how excited they are, who they think wins and loses, and whether they think change is moving too fast. The result is a rare national-scale deep dive into the public psychology of AI, extending a methodology already being applied across the US and Australia. These six mindsets predict policy views, voting behaviour, and message response more reliably than any single demographic. Two of them, the most electorally volatile, make up over a third of the electorate. (Section 3)
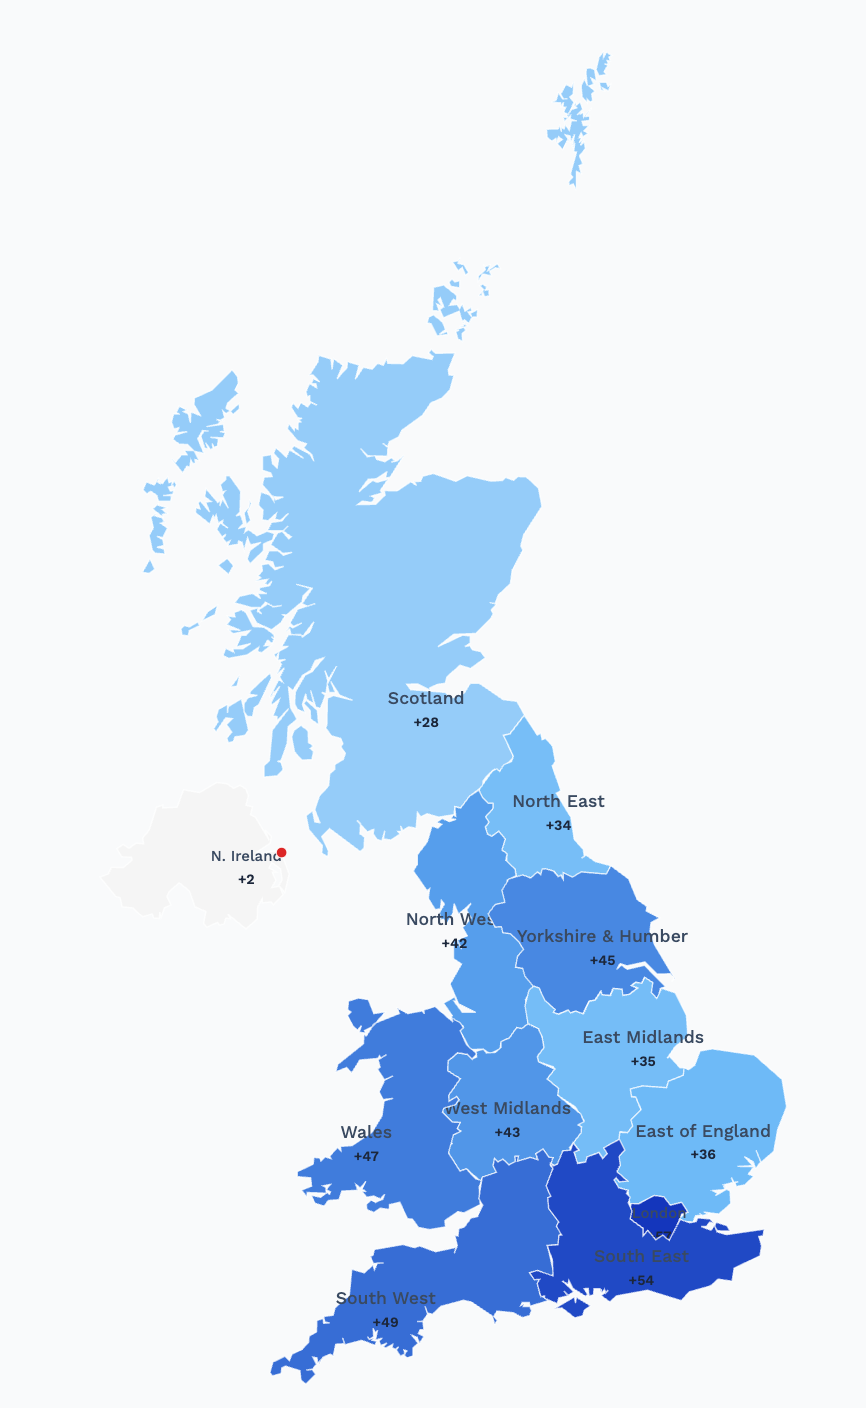
AI anxiety is reshaping the electoral map. Labour has lost between 13 and 24 percentage points across every region since the 2024 general election. Those leaving Labour are markedly more concerned about AI than those staying: they perceive more risks, feel less protected, and are more likely to say the technology is moving too fast. Where those voters go depends on whether they still trust the state to act. Where they do not, they flow to Reform. Where they do, they flow to the Greens. In the tightest marginals, seats with majorities under 3%, Reform surges to over a third of the vote while the Greens fall well below their level in safe seats. (Section 5)
AI is already embedded in the issues voters care about most. The cost of living, the NHS, jobs, housing: the public encounters AI through pricing algorithms, hiring tools, credit-scoring systems, and appointment triaging, without necessarily labelling them as such. 74% believe AI will reduce the number of available jobs. 59% are concerned about its impact on mental well-being. 57% worry about its effect on personal freedom. Treating AI as a standalone technology issue misses how people actually experience it. (Sections 1 and 3)
The strongest messages name who is responsible, the choice they are making, what is at stake, and what should be done about it. We tested five policy messages using real-time dial testing, in which respondents rated persuasiveness moment by moment on a 0–100 scale. The messages that scored highest all followed the same structure: a specific actor, a tangible consequence, and a clear remedy. Messages that offered hope without accountability, a positive vision with no named actor or concrete plan for delivery, performed well in the moment but collapsed on reflection and polarised along partisan lines. The two most electorally volatile audiences in this research, together over a third of the electorate, were most responsive to messages with this structure and least persuaded by those without it. (Section 8)
Politicians are speaking a language the public does not use. Asked to describe AI in their own words, people reach for brains, machines, monsters, and fakes. Politicians and elites reach for journeys, races, and war. The single most common elite frame, AI as “a journey” or “a path forward,” accounts for just 2.3% of how the public talks about AI. Persuasion that begins in the policymaker’s metaphors never reaches the public’s. (Section 7)
NHS data sharing is a political trap waiting to spring. On whether patient data should be shared with tech companies to improve services, the public splits by just seven points. This is the narrowest of the six policy trade-offs and the only one where the country is genuinely divided. The voters Labour still has tend to support sharing. The voters it has lost tend to oppose it, and they do so with greater intensity. If this becomes a binary cultural identity question, share versus do not share, Labour will be wedged and lose the ability to hold a broad coalition. (Sections 4 and 5)
Framing AI regulation as reining in billionaire tech power is the only frame tested bridging the Green–Reform divide. Even a majority of Reform voters prefer the anti-billionaire frame over a pro-business alternative. It reaches the populist right and the progressive left simultaneously: the two destinations where Labour’s defectors are heading. (Section 4)
The seats that decide elections tell a different story to the national average. They are more Reform-leaning, more reliant on traditional media, and hold stronger views on children’s safety and national sovereignty. Policy advocates whose networks are primarily urban and online may not be designing their messaging for these voters but the decision-makers they advise are already thinking about them. (Section 5)
Throughout this report, descriptive findings are followed by sections marked ‘Strategic Implication’, which represent the author’s strategic interpretation of the data. These are analytical judgements, not findings, and readers may draw different conclusions from the same evidence.
Methodology
This report draws on a nationally representative survey of 2,911 UK adults conducted in December 2025 by Diffusion.Au and CPS Insights, with data collected by YouGov. The survey included oversamples of Black British adults (n=250), South-East Asian adults (n=250), and voters in marginal constituencies, defined as seats decided by fewer than 3 percentage points at the 2024 general election (n=400). The data was weighted by age, gender, region, ethnicity and education to match the UK adult population, producing an effective analytical base of 2,774. After weighting, the margin of error for the full sample (p=0.5, 95% CI) is ±2.7%.
Full methodology is provided in the Detailed Methodology section at the end of this report.
1.
Overall
Sentiment

1.1 A Concerned Public
The headline finding is overwhelming: the British public is worried about AI and wants it controlled. 69% of UK adults say they are concerned about the future of AI, against just 19% who are excited. Among those who are concerned, the feeling runs deep: 55% describe themselves as ‘much more’ concerned. Among those who are excited, only 32% feel that strongly. Concern is thus both more widespread and more deeply felt.
The sense of pace is similarly one-sided. 65% believe AI is developing “too fast,” and only 2% say it is moving too slowly. This is a public that feels overtaken by a technology it did not ask for and cannot see being managed on its behalf.
When asked about specific areas of life, the public sees AI as broadly negative. Only five of eighteen areas tested attract net positive sentiment: innovation, workplace productivity, healthcare, economic growth, and government services efficiency. By contrast, areas closest to people’s daily lives, such as jobs, wages, mental health, and civil liberties, are overwhelmingly negative. The most lopsided result: 74% believe AI will reduce the number of jobs available, against just 10% who see it creating them.
Across fourteen specific AI risks, the intensity of public anxiety is striking. Over half the public (51%) is ‘extremely’ concerned about deepfakes, with a further 26% ‘very’ concerned. Privacy, children’s safety, and nuclear risk all see a third or more extremely concerned. Even the lowest-ranked items still show majority concern when the top three levels are combined.
The anxiety documented above is not uniform. When asked about specific AI outcomes, the public distinguishes between risks they expect to materialise and risks they fear in the abstract.
The most politically live issues sit in the top-right quadrant, where both perceived likelihood and concern are high: loss of personal privacy, replacement of low-paying jobs, and manipulation of financial markets. People expect these to happen and are worried about them in roughly equal measure. The top-left quadrant contains risks that generate fear but feel more distant: threats to children’s safety, bio-weapons, and nuclear control. Replacing high-paying jobs sits low on both axes; the public does not yet see AI as a professional-class threat, a perception that may shift as tools like coding assistants and legal AI become more visible.
But concern is not evenly spread, and neither is optimism. Excitement about AI is concentrated in particular groups. Under-35s, parents, AI tool users, ethnic minority respondents, and Londoners are all notably more likely to be excited about AI compared to the national average. Those who have used AI are nearly three times more likely to be excited about it than those who have not (31% vs 11%), and are over 60% above the national average for excitement. As Sections 4 and 8 show, when the public is presented with concrete policy messages about copyright protection, infrastructure investment, or worker safeguards, they respond with strong approval (scoring 71–76 out of 100). This public is not simply anxious; it wants to know what comes next, and it is looking for leadership.
1.2 An Acute Sense of Inequality
Underpinning much of the anxiety around AI is a question about who benefits and who loses. 68% believe AI will primarily benefit “the wealthiest households and corporations,” while only 10% think it will benefit the working or middle class. This goes beyond a generalised unease about technology; it is a specific belief that the gains from AI will be captured by those who already hold economic power, while ordinary people will bear the costs.
Across all five focus groups, this was articulated with the same structural frame in different political registers. Kirstie, a parent in the East Midlands, gave the political-economy argument in plain language: “make the people at the bottom, the normal, everyday life people, become reliant on this technology. Then, when we’re dependent, they’ll cut corners so they don’t have to pay anyone’s salaries, and ultimately make more money.” Stephen, a retiree in the West Midlands, gave the same frame a class vocabulary: “Collectively we have power, but the 1% control the 99%. It’s a bourgeoisie and the politic, that’s what it is. Divide and conquer.” Mira, when asked who would benefit, compressed it into two words: “Not us. Just the billionaires.” These are not outlier voices. The 68% figure is the quantitative shadow of a belief so widely held that the focus groups produced it unprompted, in every room, as the frame every other AI discussion eventually returned to.
This perception aligns with a broader structural pessimism about opportunity in Britain. When asked whether success is determined more by having done hard work or by being given opportunities, 62% chose the latter, against 27% who believe in meritocratic effort. AI, for most respondents, sits within this frame: another mechanism through which advantage accrues to those who already have it.
1.3 A Strong Regulatory Mandate Alongside a Trust Deficit
Public demand for government action is overwhelming: 85% say the UK needs stronger laws to make AI safe and secure, while just 10% prefer relying on voluntary industry guidelines. Among the two most electorally volatile mindsets in Section 3, this figure rises to near-universal levels: 96% and 94%, respectively. The regulatory mandate is not contested terrain, it is settled ground.
Our 85% is the latest point on a line that has been climbing consistently for years. The Ada Lovelace Institute/Turing Institute longitudinal tracker[1] shows support for AI regulation rising from 62% in 2023 to 72% in 2024/25, and by late 2025 Ada Lovelace polling[2] found 89% saying safety should take priority over speed, even if that means slowing development. We found the same demand building on the other side of the Atlantic in our US research with TechEquity. Different studies, different methods, different question wording, all landing in the same place and all moving the same way. This is not an artefact of how you ask the question. It is where the public is, and it has been heading here for some time.
And yet the public does not trust the institution it wants to act. 80% distrust the UK government’s ability to control AI, with almost half (48%) saying “not at all” and 31% “not too much.” Only 18% express any degree of trust. This is notably worse than general government distrust, which the Ada Lovelace Institute (2025) places at 59%. On AI, the public is even less confident that government can deliver.
This is a public demanding action from an institution they fear will not deliver it. This tension shapes the entire political landscape around AI. People believe that government is capable and competent enough to act, but they fear political leaders have been overly influenced by industry, preventing them from acting with any independence from the industry they are being asked to regulate.
Rory, an NHS clinician, named what the professional rooms kept concluding: “Labour has a position, technically, but it’s a position that was written by the tech industry that they’re regulating.” Nita, a civil servant in central government, described what that looks like from the inside: “the advisory structures around AI policy are heavily populated with people from the frontier labs, former people from the frontier labs, and a small number of think tanks funded by the frontier labs.” Chioma, a policy researcher, refused the paralysis reading: “we need rules, the only entity that can make rules is government, therefore we have to demand that government become capable of making the rules. Not that we give up on rules because we’ve given up on government. That would be surrender.”
Read this way, the paradox is not despair. It is a specific and answerable demand: political leaders willing to act at arm’s length from the industry they are meant to regulate. We found the same pattern in the US research. But how deeply voters believe the capture runs determines where their AI anxiety goes politically. Those who believe the system can still correct itself move towards the Greens. Those who do not move towards Reform. That threshold is the switch explored in detail in Section 5.1.1.
1.4 Electoral Volatility
It is typical for Britain’s governing parties to lose 2–3 percentage points of vote share per electoral cycle, and midterm troughs are the norm rather than the exception. However, this is the steepest midterm decline for any UK government since at least 1945, having shed nearly 15 points in under two years from an already historically low base of 33.7%. Only three of twenty postwar British administrations recovered from serious midterm troughs to win a further working majority. Labour’s current trajectory is not a standard case of midterm blues; it represents a structurally distinct form of multi-directional voter fragmentation for which there is no direct historical precedent.
This survey captures a moment of acute electoral instability. Labour’s loyal core has collapsed: of the 33% who voted Labour in 2024, only around 44% of those voters would do so again, leaving committed Labour support at just 14% of the electorate. Conservative support is also under pressure, declining from 15% (2024 vote) to 10% (intention to vote tomorrow). The principal beneficiaries are Reform UK (up from 13% to 23%) and the Green Party (up from 6% to 16%).
Critically, those switching their vote are disproportionately concerned about AI. Committed Labour supporters (those who voted Labour and would do so again) are less anxious about AI and perceive fewer risks. Those who are leaving Labour are markedly more concerned. AI anxiety is not the sole driver of this volatility, but it is entangled with it, and the direction of travel is explored in detail in Section 5.
2.
Demographic
Trends

The demographic profile of AI attitudes shows a number of familiar gradients by gender, age, education, and geography, but the central finding of this research is that these individual characteristics are ultimately weaker predictors of AI attitudes than economic position, professional proximity to the technology industry, or the attitudinal clusters captured in our segmentation (Section 3). The demographic patterns are worth noting, but they should be read as context for the deeper structural analysis that follows.
2.1 Gender
There is a 12-percentage-point gender gap in excitement about AI: 25% of men say they are excited, against 13% of women. Women are also 10 points more likely than men to say they are concerned. Put those together and the two groups sit about 22 points apart in how they split between excitement and concern, a gap that widens for specific risks (explored in Section 4.2), with children’s safety showing the largest gender divergence of any concern tested (+14 percentage points (pp), the difference between two percentages, not a proportional change). The gender gap is also translating into divergent voting behaviour: women are leaving Labour faster than men (-21 pp vs -12 pp) and are three times more likely to be undecided (17% vs 5%). This is a large persuadable bloc that, so far, no party has targeted.
2.2 Age
Concern about AI rises with age, from 63% of 18–24-year-olds to 78% of those aged 55 and over. The electoral weight is obvious: the over-55s are both the most concerned cohort and the largest voting bloc. However, the relationship is not perfectly linear: 35–44-year-olds show a dip (58% concerned) before concern sharply rises again from 45 onwards. The youngest cohorts are more likely to have used AI tools and are marginally more excited, but the majority of every age group remains on the concerned side of the ledger.
2.3 Education
The education gradient produces a pattern that is frequently misread. University-educated respondents are more excited about AI (25%) than those with GCSEs or who left education early (15%), which might suggest that familiarity and understanding reduce anxiety. However, university-educated people are still 63% concerned, only slightly lower than non-graduates (72%). Education increases the likelihood of engagement and excitement, but it does not meaningfully reduce worry. This fits the “familiarity paradox” explored in Section 3.3.3: knowing about AI does not make people less anxious. In many cases, it makes them more so.
2.4 Geography
AI enthusiasm concentrates in cities. 30% of respondents in large urban areas are excited about AI, falling to 14% in rural areas. This urban–rural divide maps onto a broader pattern of AI engagement: urban residents are more likely to have used AI tools, more likely to work in industries proximate to AI, and more likely to see personal benefit. London is a consistent outlier across virtually every measure, with higher excitement, higher usage, higher government trust, and lower concern. London’s structural distinctiveness is explored further in Section 5.1. Messages and policy positions tested against London sentiment and developed exclusively within London organisations are likely to systematically misfire elsewhere.
Explore all results across the entire UK by region in our interactive tool
Explore2.5 Ethnicity
The ethnic minority oversample shows one consistent pattern. Across every measure, people from Black, Asian, and other ethnic minority communities diverge from the White British sample in the same direction.
| Measure | Ethnic Minorities | White British | Gap |
|---|---|---|---|
| Excited about AI | 30% | 17% | Ethnic Minorities +13pp |
| Have used AI tools | 80% | 57% | Ethnic Minorities +23pp |
| Trust government on AI | 31% | 16% | Ethnic Minorities +15pp |
| AI benefits working people | 18% | 9% | Ethnic Minorities +9pp |
| Positive personal impact | 25% | 11% | Ethnic Minorities +14pp |
| Want strong regulation | 79% | 86% | White +7pp |
| Deepfakes concern | 72% | 87% | White +15pp |
Black, Asian, and other ethnic minority respondents are nearly twice as likely to be excited about AI, far more likely to have used it, more trusting of government to manage it, and more likely to see personal benefit. They are also 10–14pp more permissive on every policy trade-off (regulation, copyright, sovereignty, children’s access, digital ID), except NHS data sharing, where they are slightly more protective than the White sample.
Critically, this is not a libertarian tech-enthusiasm. Black, Asian, and other ethnic minority respondents are simultaneously more pro-AI and more pro-government. They are pragmatic but ultimately hopeful people who believe AI can benefit them and that government should be involved, a constituency profile that barely exists among White British respondents. They are also Labour’s most loyal remaining voter base (24.7% vs 15.6% White), with Reform at just 9.6% (vs 29.5% White).
Demographics like education and gender introduce some variation, but they only describe the surface. A 55-year-old woman and a 25-year-old man can sit at opposite ends of the age and gender scales yet share the same anxious, dismissive orientation towards AI. To understand why attitudes cluster the way they do, we have to look beneath demographics to the attitudinal structures underneath, which is the purpose of the segmentation analysis in the next section.
3.
AI
Compass

3.1 The Six Mindsets
Segmentation looks for clusters where attitudes, values, and concerns move together, exposing structure in public opinion that simple demographic breakdowns miss.
The approach used here is inspired by Yale University’s Six Americas study, which has tracked climate change attitudes through segmentation for over 20 years, and by the Climate Compass model developed in Australia. We have previously applied this methodology to AI attitudes in California; this is the first time it has been used to understand AI attitudes at a national population level.
These mindsets are built from attitudes towards AI itself (concern, excitement, trust, perceived pace, distributional fairness), not from existing electoral typologies. The difference matters: by starting with how people actually think and feel about the issue and then observing how those attitudes map onto voting behaviour, we get a clearer picture of the electoral landscape than models that begin with political identity and infer issue positions from it. As the data throughout this report shows, AI attitudes cut across partisan lines in ways that electoral frameworks alone cannot detect.
The methodology is detailed in Section 10, but the result is six mindsets that are statistically robust and strategically useful. They are not demographic labels; they are mindsets. Each one tells a coherent story about how a distinct portion of the British public experiences AI, and, as later sections show, each one predicts policy preferences, voting behaviour, message receptiveness, and the metaphors people use to describe the technology more reliably than any single demographic variable.
3.2 Meet the Mindsets
| Mindset | Pop. | Description |
|---|---|---|
| Market Optimists | 16.3% | Predominantly male (66%), working in tech at higher rates than average, with high AI usage (81%) and the highest excitement (58%). They are the only mindset where a majority (54%) think the pace of AI is “about right,” and they show a high belief that working people could benefit from AI (21%), second to the Hopeful Regulators (24%). Notably more trusting of government (41%) than other mindsets. |
| Hopeful Regulators | 12.8% | Heavy AI users (83%) who are almost perfectly split between excited (42%) and concerned (46%). High government trust (38%, second only to the Market Optimists), disproportionately working in tech/biotech (22%), and strongly pro-regulation. Youngest median age alongside Pragmatic Sceptics. |
| Pragmatic Sceptics | 16.3% | Highly educated (72% ABC1 (the social grade classification for professional, managerial, and administrative occupations, broadly the professional middle class), the highest), and the most likely to have defected to the Greens (40% vote intention). Despite high AI usage (82%), they are deeply concerned (81%) and overwhelmingly believe the pace of AI development is too fast (75%). Only 10% trust government to control AI. |
| Uncertain Middle | 11.1% | The genuine “don’t knows”. 24% are not sure if they are excited or concerned. Lower AI usage (44%) and lower social grade (53% ABC1). Currently splitting heavily towards Reform (34%) and showing high “don’t know” on vote intention (16%). |
| Alarmed Populists | 19.5% | Near-zero excitement (<1%), near-universal concern (97%), and 89% say AI is moving too fast. Older (44% are 55+), majority female (58%), and profoundly distrustful, with only 3% having trust in government to control AI. Splitting between Reform (25%) and Green (28%), representing both right and left populist responses to AI anxiety. |
| Disengaged Traditionalists | 24.1% | The oldest mindset (67% are 55+, 48% retired) and the least engaged with AI (only 31% have used it; very few are thinking about it). High concern (83%) despite low familiarity. Lowest social grade (48% ABC1) and heading firmly towards Reform (40% vote intention). Will likely only engage when AI impacts become tangible in daily life. |
3.3 Overall Sentiment Charts by Mindset
The six mindsets are easier to read as three pairs, each representing a distinct orientation towards AI.
The Market Optimists (16.3%) and Hopeful Regulators (12.8%) are the optimistic pair: 29.1% of the adult population. Both are heavy AI users, both younger than average, and both more likely to work in or around the technology sector. But they want different things from government. Market Optimists are the closest thing in the data to a pro-innovation constituency: a majority think the pace of AI development is about right, and they are the only mindset where the industry message tested in Section 8 scores highest. Hopeful Regulators share the engagement but not the relaxation. They are almost perfectly split between excited and concerned, and they pair high government trust (38%) with strong support for regulation. These two mindsets are often conflated in policy debates as “the tech-friendly public,” but they diverge on whether the market or the state should lead.
Ben’s on the tools; Kate’s on the rules. Ben, a machine-learning engineer, on his daily AI use: “I’ve got Copilot open literally all day. I use it for code completion, for writing tests. It’s woven in.” Kate, a policy adviser, on AI governance: “institutionally, we can manage this, if we choose to.”
The Pragmatic Sceptics (16.3%) and Alarmed Populists (19.5%) are the anxious pair: 35.8% combined and the most politically volatile bloc in the data. Both are deeply concerned, but they arrive there from opposite directions. Pragmatic Sceptics are the most educated mindset (72% ABC1), heavy AI users (82%), and the most likely to have defected to the Greens (40% vote intention). Their anxiety is informed. Alarmed Populists are older, majority female (58%), and profoundly distrustful, with only 3% trusting the government to control AI. Their concern is closer to alarm than scepticism: near-zero excitement, 97% concerned, 89% saying AI is moving too fast. Both mindsets are abandoning Labour in large numbers, but in opposite directions, a divergence explored in detail in Section 5.
Deepak demystifies; Rashid mythologises. Deepak, a senior engineer at a tech firm: “statistical pattern matching. That’s what it is… The word ‘intelligence’ is marketing.” Rashid, a retiree in the Midlands: “It’s like a new God to us. It’s like a God that could destroy our whole society.”
The Uncertain Middle (11.1%) and Disengaged Traditionalists (24.1%) are the largest combined bloc at 35.2%, and the hardest to reach. The Uncertain Middle are the genuine “don’t knows”, with a quarter not sure whether they are excited or concerned. Disengaged Traditionalists are the oldest mindset (67% over 55), the least likely to have used AI (31%), and the most likely to see it as irrelevant. Both are heading towards Reform, but passively rather than ideologically: they are not motivated by a competing vision of AI governance so much as defaulting to the most visible anti-establishment option.
Bryan’s curious; Jeff checks out. Bryan, a retiree: “I’m not really concerned about it, I’m not really excited by it, really… I’m intrigued to see how it goes.” Jeff, a retiree: “I’m glad I’m the age I am now, when I see what’s happening in the world.”
Mindset membership also cuts across the demographic patterns documented in Sections 1 and 2. Women are overrepresented among Alarmed Populists but also among Hopeful Regulators, a mindset with high government trust. The gender gap in concern does not map cleanly onto a single political disposition. University graduates are spread across three mindsets that agree on very little except that AI is worth paying attention to: Pragmatic Sceptics are the most educated mindset in the sample and among the most anxious.
Mindset membership is strongly predictive of whether respondents believe AI will have positive or negative impacts across a wide range of outcomes.
3.3.1 Where the Mindsets Agree
Despite the variation in how these mindsets experience AI, the areas of consensus are striking. On regulation, the demand is near-universal: even the Market Optimists, the mindset most sympathetic to industry, overwhelmingly support stronger government powers. The only real variation is in intensity, not direction.
Excitement is where the mindsets diverge most sharply. Market Optimists are the only mindset with a majority who are excited about AI’s future. Every other mindset, including the Hopeful Regulators who use AI at comparable rates, tilts concerned.
3.3.2 Economic Anxiety as the Common Thread
One pattern visible at the mindset level, but not in the demographic data, is the tight correlation between AI concern and economic populism. Five of six mindsets believe AI will primarily benefit the wealthy. The mindsets most anxious about AI are also the most likely to prefer the “rein in billionaires” frame and to see success in Britain as determined by opportunity rather than effort. For these mindsets, AI is not an abstract technology concern; it is the latest mechanism through which advantage accrues to those who already hold it.
The sense of pace reinforces this. Almost nobody thinks AI is moving too slowly; the variation is between “too fast” and “about right,” and only the Market Optimists lean towards the latter.
Yet, the very institution the public wants to act is one it does not trust. Government distrust is the norm across all six mindsets with the only variation by degrees. This tension, between a regulatory mandate and a trust deficit, is the central dynamic in the politics of AI, and is explored in detail in Section 5.
3.3.3 The Familiarity Paradox
Knowing about AI does not make people less worried; it may actually make them more so.
A common assumption in technology policy (often referred to as the “deficit model” in science communication literature) is that public anxiety stems from unfamiliarity: if people understood AI better, they would be less concerned. The data challenges this assumption directly.
- 71% of respondents say they are “somewhat” or “very” familiar with AI
- 60% have personally used an AI tool like ChatGPT, Gemini, or Copilot
- Yet 69% remain concerned about AI’s future, and 65% say the pace of development is “too fast”
Familiarity and concern are not inversely related; they coexist. This is particularly visible in the mindsets.
| Mindset | Have Used AI | Concerned |
|---|---|---|
| Hopeful Regulators | 83% | 46% |
| Pragmatic Sceptics | 82% | 81% |
| Market Optimists | 81% | 27% |
| Alarmed Populists | 52% | 97% |
| Uncertain Middle | 44% | 62% |
| Disengaged Traditionalists | 31% | 83% |
To test this more rigorously, we developed an AI Literacy Index. The AI Literacy Index measures what people actually understand about AI, not just whether they have heard of it or used ChatGPT. Each respondent answered nine questions testing their grasp of how AI works and where its risks lie. Their answers were combined into a single score on a 0–100 scale, where higher scores reflect greater understanding. The Literacy Index measures demonstrated understanding, and what it shows is that the relationship between knowledge and concern is nothing like the simple story policymakers tend to assume.
This is consistent with the Ada Lovelace/Turing Institute longitudinal tracker[1], which found that awareness of AI applications increases perceived benefit in some domains (such as health screening and scientific research) while amplifying concern in others (targeted advertising, recruitment). Familiarity does not move attitudes in a single direction; it interacts with the values and priorities people bring to the question.
Our data makes the failure of the deficit model concrete. The three highest-usage mindsets (Hopeful Regulators, Pragmatic Sceptics, and Market Optimists) all report above 80% AI usage. Their concern levels range from 27% to 81%. The same depth of experience produces radically different conclusions, depending not on what people know but on what they value and what they feel is at stake.
The Pragmatic Sceptics are the sharpest test of the deficit model. They are heavy users (82%), highly educated (72% ABC1), and deeply concerned (81%). By every measure the deficit model relies on, this group should be reassured. They are not. They know what AI can do, and that is precisely why they worry.
This matters for any communications strategy. Messaging that seeks to “educate” the public about their concerns may misread the problem. People are not scared because they do not understand AI; many are scared because they do. What they are looking for is not explanation, it is real confidence that someone is in control and protecting their interests.
3.3.4 AI as the Invisible Infrastructure of Voter Concerns
AI does not appear as a standalone priority when voters are asked what issues matter most. Cost of living (29%), immigration (23%), NHS (17%), and jobs (11%) dominate. AI, as a category, is in the low single digits. Effectively non-existent.
But this misreads how AI already appears in people’s lives. For most people, AI is not a discrete issue: it is the invisible infrastructure through which other concerns are mediated.
The qualitative work across five focus groups produced five distinct registers of felt harm, each with its own lived-experience vocabulary.
Cost of living and predatory pricing. This is the register where cost-of-living anxiety and AI concern meet most directly. Dynamic-pricing algorithms now set what people pay for Uber rides[3], concert tickets[4], airline fares[5], insurance premiums[6], groceries[7] and even a pint[8]. People believe the “surge” is not a market signal but a machine calculating your willingness to pay and extracting it. When a dynamic-insurance-pricing scenario was read aloud in one focus group, every person in the room believed it was already happening before the moderator could finish the prompt. Sarah, in Darlington, described the feeling as “kind of ripped off.” Sophie, a youth worker in Peterborough, made the technology itself the agent, “human beings discriminate… and technology is also doing it even worse,” and volunteered a consumer-defence tactic unprompted: “If you want to book a holiday, and you just want to sort of browse at what’s available, use incognito mode, because otherwise, the next time you go to book it, they’ll use everything they know about you to jack the price up.” In a later session, Chioma, a policy researcher, named what was specifically new about the mechanism: “it’s not new. What’s new is the granularity. It’s not that insurance prices vary by postcode any more. It’s that they vary based on, you know, forty, fifty different signals about you that you have no idea are being collected.” Throughout each room, there was a consistent sense of anger and a push to try to reclaim some power and agency. And cost-of-living anxiety, already the dominant concern in every room, now has an AI face.
Jobs and algorithmic hiring. 74% of respondents expect AI to reduce the number of jobs available. Hiring algorithms already filter CVs; performance-management systems track productivity. Dionne, a Black British jobseeker, described the moment the filter became visible to her: “I had not even fully submitted the application yet, but got rejected. So, I was wondering what went wrong, and it’s… I just felt, okay, this has to be AI. Just something that saw my shadow at the back end and decided I was not qualified, even without fully seeing my application.” Flora, an employment lawyer in London, sees the same pattern in the workplace: “It’s specific clients losing specific jobs because of specific opaque systems.” The problem compounds when those clients seek remedy: “if an AI-mediated decision is made about you, there is no reliable route to judicial challenge that the ordinary person can take. The tribunals are not equipped. The courts aren’t equipped.”
Clinical AI and public services. AI systems are already triaging patients[9], screening for disease, and allocating appointments. The NHS data sharing debate (Section 5.3) is a live question about whether health records become training data for private companies[10]. The question the focus groups surface is not whether the tools work. It is whether the liability, evaluation, and procurement frameworks have caught up with them. Nisha, an NHS data analyst in Leeds, worries that “the NHS gets pitched things, it signs contracts, and the people who sign the contracts don’t always understand the technology. And that’s a recipe for something going wrong.” Helen, a GP partner in Bristol, closes the register with the liability question a trainee had posed by running a patient’s blood results through ChatGPT without asking anyone: “if you’d actioned this, and it was wrong, what’s the chain of responsibility? Is it you, who actioned it? Is it me, who’s supervising you? Is it the consultant, who signed off? Is it OpenAI, who made the thing? Is it the Trust, who didn’t explicitly prohibit it? Nobody has a clean answer to that question.” The tools are already in every clinician’s pocket; the liability framework is not.
Locking-out the vulnerable. The final register is the harm that falls hardest on people already on the wrong side of the digital divide. Stephen, a retiree in the West Midlands, offered the cleanest single vignette: “My dad’s 83 years of age. He can’t read or write, so he’s locked out of lots of society. If you ring the doctors, it’s all machines. Unless you’ve got somebody who’s gonna advocate for you, you don’t understand. And I think this AI thing is making it all worse.” Farah, a council digital-inclusion officer in Birmingham, carries the same frame in a younger voice and a sharper political edge: “my council, like every council, is always saying, we’re going to use AI to do more with less. And I’m going, less what? We already had less. My nan still can’t book her own diabetic check. Don’t put an AI on top of that and call it progress.”
Epistemic collapse and the loss of a shared reality. The 51% deepfake-concern figure is the tip of a deeper frame the focus groups returned to, unprompted, across every room. It is not only fake pictures. It is the sense that the information environment is being bent against its users. Gary, a medical-regulator case reviewer, put it most cleanly: “AI is being used to trigger our emotions and push media at us, so that we always have the worst outcome in our minds. And that has led to so much hate.” Yasmin, a single mother in the Midlands, worried about how easily a deepfake could be applied to relationships and family life: “As little as a disgruntled colleague could break up marriages.” Debbie, in the same room, named the inverse problem with AI as an excuse to disbelieve what is real. On Trump’s Truth Social image of himself as Jesus, she said people’s “automatic response was, ‘It’s AI, he hasn’t actually posted it.’ And it’s like, well, yeah, he has.” Diane, a former teacher in Lancashire, pointed to the register closest to direct harm: cases where users bring suicidal ideation to AI chatbots, and the chatbot agrees with them. “Your little friend in your pocket, and it will more or less go with how you’re sounding until you stop it and say, hang on, that’s wrong. And then it goes. Oh, yes.”
Across the five groups, one register stood apart as the only one where participants reached towards AI rather than away from it. The reach was always conditional on AI filling a gap in failing public services, with commercial terms aligned to the public interest. Linda, a grandmother in Birmingham, reached towards AI from inside her family’s dementia-care crisis: “£3,000 a week for this care, which is eye-watering… I understand in some countries, maybe Japan, they are looking at AI assistants, like robots… what would that look like for the future? I don’t know.” Rory, who runs a children’s mental-health service in NHS Scotland, reached through a pilot of his own: “the pilot I’m running right now, if it works, means a teenager with suicidal ideation waits 12 weeks instead of 18 for their first CAMHS appointment. Twelve weeks is not good. Eighteen is a disaster. I spend a lot of my life trying to make ‘not good’ out of ‘disaster’ and that, honestly, is what pro-regulation AI work looks like.” Strip the public-interest condition and the same voices reverse direction. This is not a door to “AI will fix the NHS” messaging. It is a door to “AI deployed under public-interest terms can close gaps the state has left open.” The condition is doing the work.
The mindsets most likely to be mobilised by this framing are the Alarmed Populists (20%) and Pragmatic Sceptics (16%), together, over a third of the electorate, who already believe AI primarily benefits the wealthy and who are actively switching their votes.
The implication for political communicators is that messaging around AI policy should not treat it as a standalone technology issue. It should be linked to the concerns people already prioritise: “AI is why your insurance premium went up.” “AI is why your CV never got seen.” “AI is being used to decide who gets a council house.” This grounds an abstract anxiety in lived experience and connects it to the issues that already drive vote choice.
It is also clear that anyone who wants to build consensus and support for technology policy in the UK needs to enfranchise the Hopeful Regulators and keep them engaged. Their combination of high AI literacy and high government trust makes them valuable allies, but if the government or civil society appear hostile to progress, industry offers a ready-made alternative: responsible innovation pitched to their optimism while quietly substituting voluntary commitments for enforceable rules. While the Pragmatic Sceptics are unlikely be won by a reassuring tone and a promise; they need substantive proposals they can interrogate. And for the Alarmed Populists and Disengaged Traditionalists, the priority is demonstrating strength and competence as they will not engage with the detail until they believe someone credible is in control.
3.3.5 Where These Audiences Live Online
These mindsets do not share a media diet, and their platform profiles diverge sharply:
| Platform | Pragmatic Sceptics | Alarmed Populists | Disengaged Trad. | Hopeful Regulators | Market Optimists |
|---|---|---|---|---|---|
| YouTube | 66% | 56% | 45% | 72% | 63% |
| 55% | 54% | 67% | 72% | 62% | |
| 63% | 40% | 38% | 56% | 52% | |
| 32% | 15% | 5% | 13% | 22% | |
| TikTok | 25% | 16% | 14% | 39% | 29% |
| Bluesky | 10% | 7% | 1% | 5% | 2% |
Pragmatic Sceptics (the educated, AI-literate, pro-regulation mindset driving the Green surge) are disproportionately represented on Reddit (32%) and Bluesky (10%) compared to other mindsets. Disengaged Traditionalists (24% of the population, driving the Reform surge) are overwhelmingly Facebook-dependent (67%) with minimal uptake of newer platforms. Hopeful Regulators are the heaviest TikTok users (39%).
Any communication strategy targeting these audiences needs to account for this platform divergence; a single-channel approach will systematically miss entire mindsets.
4.
Policy
Views

4.1 There Is a Clear “Protective” Consensus on Most AI Policy Questions
Respondents were presented with six paired statements, each framing a genuine policy trade-off. Rather than asking whether people support or oppose a single proposition, each pair offered two defensible positions representing competing values: innovation against protection, openness against restriction, trust in companies against trust in government oversight. Respondents chose the statement closer to their view.
This format matters. It avoids a known problem with agree/disagree questions, where people tend to agree with whatever statement you put in front of them, and instead forces a genuine choice between two competing positions. The result is a clearer picture of where the public lands when trade-offs are made explicit.
The six trade-offs covered:
- Digital identity: whether a national digital ID would simplify access to services, or give officials and companies too much power to track people
- Copyright and training data: whether AI companies need lawful access to copyrighted material to keep the UK competitive, or whether creators should have to give explicit permission and be compensated
- AI safety and oversight: whether leading AI companies should be trusted to manage safety voluntarily, or whether government should have powers to investigate, audit, and halt risky AI systems
- Children and AI: whether young people should be able to use AI tools as preparation for a digital world, or whether those tools should be more tightly restricted to protect them from harm
- Sovereignty and dependency: whether relying on American AI keeps the UK at the cutting edge, or whether it makes the country too dependent on foreign powers
- NHS data sharing: whether the NHS should share anonymised health data with trusted researchers and companies to develop treatments, or whether health records should not be shared with private companies even in anonymised form
On five of the six, the British public clusters decisively towards the protective option, though the margin varies considerably.
| Policy Trade-off | Protective Position | Strongly | Permissive Position | Strongly | Not Sure | Net |
|---|---|---|---|---|---|---|
| Independent AI Oversight | 78% want government powers to investigate, audit, and halt risky AI systems | 44% | 10% trust companies to self-regulate | 2% | 11% | +68pp protective |
| US Dependency | 69% say relying on American tech makes the UK too dependent on foreign powers | 31% | 15% say US tools keep UK competitive | 3% | 16% | +54pp protective |
| Copyright | 70% want restrictions on using copyrighted/public data for AI training | 36% | 17% say access is necessary for UK competitiveness | 3% | 14% | +53pp protective |
| Children’s Access | 67% want tighter restrictions on children using AI tools | 31% | 23% say kids should use AI to prepare for digital world | 3% | 11% | +44pp protective |
| Digital ID | 51% oppose national digital ID (privacy concerns) | 30% | 35% support making online ID easier | 11% | 14% | +16pp protective |
| NHS Data Sharing | 48% oppose sharing anonymised health data with private companies | 27% | 41% support sharing for research/treatment | 11% | 11% | +7pp protective |
On questions spanning independent oversight, data sovereignty, copyright, and child safety, the public favours protective action over the status quo by net margins of 44–68 percentage points. Combining ‘strongly prefer’ and ‘somewhat prefer’ responses, large majorities back government power to investigate, audit, and halt risky systems (78%), new copyright restrictions (70%), and tighter protections for children (67%). Even looking only at ‘strongly prefer’, 44%, 36%, and 31% respectively, the protective position leads at every level of conviction. A finely balanced debate this is not. Across every issue tested, the public lands on the same side.
Digital ID and NHS data sharing are the closest to balanced, but even these now tilt protective. Digital ID splits 51/35 against, likely because both options invoke legitimate concerns (convenience vs privacy) without a clear “elite vs public” frame. NHS data sharing is the narrowest margin at +7pp, explored in detail in Section 5, where the country remains divided, and the political risk is highest.
4.1.1 The Gap Between Public Opinion and Political Discourse
There is a gap between these preferences and elite debate. On copyright, for example, the government’s consultation proposed a text-and-data-mining exception with an opt-out mechanism as its preferred option, allowing AI companies to train on copyrighted material unless creators explicitly reserved their rights. Fewer than one in five members of the public support this position, and even within that minority, most express only weak preference rather than strong conviction. On regulation, despite including it in the 2024 King’s Speech[11] and Labour’s 2024 manifesto commitment[12] to binding rules on frontier AI developers, no AI Bill has been introduced[13]. The government’s own AI Opportunities Action Plan described the existing pro-innovation approach as “a source of strength”[14]. Peter Kyle characterised the government’s stance as “light touch, but assertive”[15], and the government has opted for non-binding agreements with companies[16], including OpenAI and Anthropic, rather than statutory oversight. Just 10% of the public supports a voluntary approach, and again, most of that small minority expresses only a weak preference.
This creates an opening: politicians who back strong rules, enforceable accountability, and UK sovereignty are aligning with 67–78% of voters. The risk is not being “too interventionist.” The risk is appearing captured by an industry position that commands minority support.
These findings are broadly consistent with the Tony Blair Institute/Ipsos study[17] of 3,727 UK adults (June 2025), which found that 39% view AI as an economic risk versus 20% who see it as an opportunity, and that a majority believe government, not companies, should be primarily responsible for ensuring AI is safe. The Ada Lovelace Institute’s polling[2] of 1,928 UK adults (September 2025) found that 84% are concerned the government will prioritise the needs of the technology sector over the public interest, and that 89% believe safety should take priority over speed, even if this means slowing development.
The convergence matters because these three studies differ in design, timing, and purpose: the TBI study uses a random-probability panel and frames its recommendations around accelerating adoption; the Ada Lovelace Institute uses rapid-response polling focused on governance expectations; this research uses forced-choice trade-offs designed to surface the strength of conviction behind policy preferences. That all three arrive at the same directional finding, a public that wants regulatory action and does not trust industry self-governance, suggests the result is robust across methodological choices.
The 85% who back stronger regulation are also more politically active, and more likely to vote, than the roughly 10% who prefer lighter-touch, industry-led approaches. In the past year, 57% of Alarmed Populists and 53% of Pragmatic Sceptics signed a petition, and roughly a quarter contacted their MP. Among Market Optimists, the only mindset that leans pro-innovation, 45% did nothing at all. The Uncertain Middle is even less active (53% did nothing). This means the regulatory mandate is not just a poll finding; it is backed by the more energised and engaged side of the electorate. Politicians face asymmetric risk: the people who want strong regulation will punish you if you do not deliver; the people who prefer a lighter touch mostly will not show up.
This also contributes to the two rhetorical traps which have consistently served to contain the scope of AI reform.
The first trap is getting drawn into a capabilities debate, in which advocates spend their time arguing about what AI can or cannot do. The fossil fuel industry used the same strategy for decades, trapping climate advocates in disputes over whether climate change was human-caused and delaying action as the window for intervention narrowed. The AI industry benefits from a similar dynamic: every hour spent squabbling over whether the hallucination rate is 5% or 8% is an hour not spent building public support for enforceable rules. Worse, those arguments can end up creating more confusion than clarity, leaving people unsure whether these systems have serious social consequences at all. Advocates do not need the public to understand how AI works. They need the public to back strong rules that protect them.
The second is getting caught in the children’s safety frame. Children’s safety is a genuine and important concern, and this report documents the strength of public feeling on the issue (Section 4.2). But if children’s safety becomes the only domain where AI regulation is politically acceptable, it effectively ring-fences reform away from the structural issues that affect the entire adult population: copyright, worker protections, digital sovereignty, and corporate accountability. Industry benefits from a regulatory conversation confined to age verification and content filters, because that conversation does not threaten its core business model. The strongest position treats children’s safety as one part of a broader protective agenda, not as its entirety.
4.1.2 The “Billionaire Power” Frame Crosses Partisan Lines
A separate trade-off question tested whether people prefer to “rein in the unchecked power of billionaires” or “encourage and support business and engineers to drive growth.” The result: 63.5% chose the anti-billionaire frame vs 27.1% for the pro-business position.
What makes this finding strategically distinctive is its cross-partisan reach:
| Vote intention (tomorrow) | “Rein in billionaires” | “Support business” | Not sure |
|---|---|---|---|
| Green | 90% | 6% | 4% |
| Labour | 62% | 31% | 7% |
| Reform | 55% | 34% | 11% |
| Conservative | 47% | 49% | 4% |
Even a majority of Reform voters prefer the anti-billionaire frame. The only group that splits evenly is Conservatives. This is the only policy frame tested that genuinely bridges the Green-Reform divide, the two destinations where Labour’s defectors are heading. For AI policy advocates, framing regulation as “reining in billionaire tech power” may be more effective than “consumer protection” or “responsible innovation”; it appeals to both the populist right and the progressive left simultaneously.
4.2 Children’s Safety and Gender Analysis
The 12-point gender gap in AI excitement (men 25%, women 13%) noted in Section 2 understates a more significant pattern: women are substantially more concerned across every AI risk category, and this concern tracks with distinct and divergent voting behaviour.
Children’s safety is the key differentiator.
| Concern Category | Male | Female | Gap |
|---|---|---|---|
| Threaten children’s safety | 51% | 65% | +14pp |
| Reduce personal privacy | 58% | 69% | +11pp |
| UK digital sovereignty | 42% | 54% | +12pp |
| Weaken national security | 47% | 56% | +9pp |
| Deepfakes | 73% | 82% | +9pp |
Children’s safety shows the largest gender gap of any AI concern measured. This is unsurprising (parental anxiety tends to be gendered), but it matters because it links AI to an emotionally potent, visceral domain that transcends abstract debates about technology.
Counterintuitively, parents with children under 18 are actually less concerned about AI threats to children (38%) than non-parents (41%), and are more excited about AI overall (27% vs 16%), likely because they see their children using AI tools productively (75% of parents have used AI vs 53% of non-parents). The “protect the children” frame may therefore resonate most powerfully not with parents but with the anxious non-parent majority, particularly over-55 women with grown children, for whom AI and children are an abstract but emotionally charged concern.
4.2.1 The Persuadable Bloc: Women Who Have Not Yet Decided
Women are three times as likely to be undecided (17% “Don’t Know” vs 5% for men). This represents a significant persuadable pool, roughly 1 in 6 female voters, who share the protective concerns driving both Green and Reform defection but have not committed. Their concerns about children, privacy, and safety are not being met by Labour’s current messaging around technology, which remains largely weighted towards innovation and economic opportunity.
Of the women who have declared a change in their vote, they are going in opposite directions from men.
| Party | Male Swing | Female Swing |
|---|---|---|
| Labour | -12pp | -21pp |
| Reform | +15pp | +12pp |
| Green | +11pp | +15pp |
| Do not Know | 5% | 17% |
Labour is haemorrhaging women faster than men (-21pp vs -12pp), but where these voters are going is more complex than a simple left/right split. Men are flowing primarily to Reform (+15pp); women are flowing to both Reform (+12pp) and Green (+15pp) in roughly equal measure. As a result:
- Men’s top party tomorrow: Reform (30.7%), then Labour (21.1%), then Green (15.4%)
- Women’s top party tomorrow: Reform (22.7%) and Green (22.4%) are essentially tied, followed by Do not Know (16.5%), then Labour (12.5%)
The same underlying anxiety that AI is moving too fast, the benefits flowing to corporations, and that children are at risk, is producing distinct responses by gender, but with a shared trajectory away from Labour and towards both Reform and Green. Men channel the anxiety more heavily through economic nationalism and anti-establishment sentiment (Reform); women are genuinely split between Reform’s populist appeal and Green’s protective progressivism, with a large undecided bloc still in play.
4.3 Favourability of Institutions and Public Figures
The survey tested favourability of institutions and figures as potential messengers on AI. The results reveal a clear hierarchy, and a major gap between where credibility sits and where policy attention is currently directed. Independent regulators and the police sit at the top; Elon Musk and Keir Starmer at the bottom.
Three findings here are strategically significant:
Independent regulators dramatically outperform the AI Security Institute (AISI) in its current form. On a net basis (favourable minus unfavourable), regulators score +26, the highest of any institution tested. AISI scores lower, at -8, but this reflects obscurity more than hostility: it draws the highest rate of uncertainty of any institution tested, with 54% of respondents expressing no opinion at all, consistent with the institute being virtually unknown to the public.
This gap matters because AISI does not currently have statutory powers. It operates as a team within the Department for Science, Innovation and Technology, conducting voluntary safety evaluations of frontier AI models. Since 2023, both major parties have committed to putting it on a statutory footing. The Conservative Sunak Government originally proposed this, and Labour included it in its 2024 manifesto and the King’s Speech, but legislation has not followed. The public’s strong preference for an independent regulator to be established over AISI in its present form suggests the demand is not for the institute as it exists, but for what it was promised to become: an independent body with legal powers to investigate, audit, and enforce. If the goal is to build public confidence in AI governance, the vehicle should look and feel like an independent watchdog with statutory teeth, not a government-adjacent institute operating on a basis of voluntary cooperation.
Framing AI as “American tech” activates real suspicion. On a net basis, generic “AI technology companies” already sit at -24, and “US AI technology companies” fall further to -33, a 9-point net penalty nationally simply for naming where the company is based. Among Hopeful Regulators the gap is even wider: their favourable rating drops from 65% for AI companies to 47% for US AI companies. The sovereignty frame identified in Section 4.1 is not abstract; it is grounded in a tangible distinction people already make between “AI” and “American AI.”
Elon Musk is the most polarising figure tested. He scores 44% favourable among Reform UK voters but only 3% among Green voters. He functions less as an individual and more as a political identity marker: any AI advocate who is visibly aligned with or against Musk will be coded by the audience accordingly. For policy communicators, this means the AI debate is already partially mapped onto a Musk/anti-Musk axis, whether they want it to be or not.
A fourth finding is visible only in the qualitative work. The data measures trust in a category: independent regulators. The focus groups tested whether the public could name a specific person they trusted on AI. Across all five rooms, no participant could. The gap they named was not the absence of expertise. It was the absence of a popular, accessible face. Karim put it plainly: “there’s no Brian Cox for AI, there’s no-one who everybody would recognise and trust.” Flora applied the everyday test: “Nobody I’d point my mum to.” Chris, a political historian, landed on the same conclusion in a single line: “Nobody with broad reach.” The voice people were reaching for was someone on the scale of a David Attenborough or a Brian Cox: a figure with an established public relationship, whose cultural credibility predates AI and has the reach to carry a new subject with it. And the absent roster would need to be plural, with voices who reflect the audiences they are reaching, not a single all-purpose translator. Section 9’s funder recommendations take this up.
Favourability by Mindset
NET favourability varies dramatically by mindset. Market Optimists are the only mindset with broadly positive sentiment towards AI companies and political figures, while Alarmed Populists are net negative on almost every entity tested.
5.
Voter
Behaviour

There is significant movement within the electorate since polling day 2024. Some loss of confidence in the governing party is normal at this stage of a parliamentary cycle. What is unusual is the scale and direction: voters are not parking with the official opposition but flowing to minor parties, particularly Reform and the Greens, in numbers that suggest structural realignment rather than midterm protest.
Labour’s situation is structurally different from a standard midterm slump in three respects.
First, the starting base was uniquely shallow. At 33.7%, Labour’s winning vote share was already below the typical midterm nadir for most postwar governments. Governing parties normally lose support between elections. Nannestad and Paldam’s[18] foundational work established an average cost of 2.25 percentage points per cycle, but most begin from a position where such losses are absorbable. Labour did not.
Second, voter migration is flowing in multiple directions simultaneously: to Reform on the right, the Greens on the left, and the Liberal Democrats in the centre. This creates a policy trilemma where remedies for one flank’s defection may exacerbate the other’s. Previous third-party insurgencies (UKIP, the SDP) were essentially unidirectional.
Third, negative competence judgements formed within Labour’s first six months. Green and Jennings’[19] research on the asymmetry of performance information shows that once voters conclude a government is performing poorly, positive information has diminishing power to reverse that judgement. The window for recovery narrows quickly, and radical action is required to achieve such a reset.
This section examines the Labour collapse by region and where defectors are heading (5.1), the dynamics in marginal seats (5.2), and the one policy issue where the electoral risk is most acute: NHS data sharing (5.3).
5.1 Labour Collapse by Region and Direction of Travel
Labour is collapsing everywhere (-13 to -24 percentage points across regions), but where these voters are going differs dramatically. The most strategic beneficiary is Reform, which is performing especially well in marginal constituencies at +14.3pp (compared with +9.4pp in safe seats across all parties), while the Greens are much weaker in these marginal seats at +9.2pp (compared with +11.8pp in safe seats). As a result, unsurprisingly, Labour’s collapse is worse in the marginals at -17.8pp (vs -16.0pp in safe seats).
When reviewing this by region, the largest shock is in traditionally left-leaning Scotland, where Reform is surging by +21pp (the highest in the UK). Meanwhile, in London, Wales, Yorkshire, and the South East, which still have many seats but relatively fewer knife-edge contests that determine elections, Labour losses flow mostly to the Greens. Something borne out in reality by the 2026 Gorton and Denton by-election, which saw the Greens take a seat directly from Labour. The May 2026 local elections, held after this survey was fielded, pointed the same way: Labour lost ground across the board, shedding seats to Reform in the North and Midlands and to the Greens in its urban strongholds, broadly reproducing the two-directional pattern described here.
| Region | Labour Δ | Con Δ | Reform Δ | Green Δ | Lib Dem/Other Δ | Direction of Defection |
|---|---|---|---|---|---|---|
| London | -13pp | -4pp | +7pp | +12pp | +2pp | LEFT (Green 1.6x Reform) |
| Wales | -24pp | -2pp | +5pp | +13pp | +8pp | LEFT (Green 2.7x Reform) |
| South East | -15pp | -3pp | +12pp | +17pp | -1pp | LEFT (Green 1.4x Reform) |
| Yorkshire | -20pp | -1pp | +15pp | +19pp | -2pp | Split (both surging) |
| East of England | -21pp | -9pp | +17pp | +18pp | +2pp | Split (both surging) |
| East Midlands | -18pp | -2pp | +11pp | +11pp | +3pp | Split |
| Scotland | -20pp | -2pp | +21pp | +3pp | -4pp | RIGHT (Reform 6.4x Green) |
| West Midlands | -21pp | -4pp | +15pp | +12pp | +4pp | RIGHT (Reform 1.3x Green) |
| North West | -14pp | -1pp | +17pp | +9pp | +4pp | RIGHT (Reform 1.9x Green) |
Note: The swings in this table are calculated between 2024 recalled vote and “vote tomorrow” intention. Keen readers will notice that the numbers don’t add up to a neat zero here. About one in six people didn’t vote in 2024, but now do name a party. That extra support is why Reform and the Greens can each grow by more than Labour or the Conservatives have fallen.
5.1.1 What Appears to Be Motivating These Different Directions of Travel?
What separates the “Reform surge” regions from the “Green surge” regions is not simply fear of AI. Concern about AI is broadly similar across the country. What varies much more sharply is whether people believe the government can competently act, and that difference appears to shape which political outlet AI anxiety takes.
Where trust in government is low, people do not just worry about AI; they assume the state is either too captured, too inept, or too distant to control it in meaningful ways. In those places, the message “AI will be regulated responsibly” risks being dismissed as fantasy or as establishment reassurance that does not reflect their lived experience. Reform benefits because it offers an anti-establishment channel for the same unease: the problem is not only the technology; it is that the system will not protect you from it.
Where trust in government is higher, people can still be anxious about AI, but they retain a basic belief that public power can be used to set rules, if pushed. That creates more space for Green-style politics: sceptical of corporate power, hungry for accountability, but not cynical about the possibility of government action. In these contexts, “ethical AI,” “corporate accountability,” and “strong rules” do not sound like empty promises; they sound like plausible demands.
In practice, distrust acts as a switch on existing anxiety, routing it into either a demand for tougher rules (Green) or a rejection of the system’s legitimacy to deliver them (Reform).
| Region | Govt Distrust (None at all) | Reform Surge | Correlation |
|---|---|---|---|
| Scotland | 51% | +21pp | Lower distrust, but the highest Reform surge |
| East Midlands | 64% | +11pp | High distrust → High Reform |
| North East | 62% | +14pp | High distrust → Moderate Reform |
| London | 34% | +7pp | Low distrust → Low Reform |
London is a consistent outlier on virtually every measure: 29.2% excited about AI (vs 18.6% nationally), 11.4% trust government “a lot” (vs 4.0%), 70.8% AI usage (vs 59.8%), and only 33.8% extreme distrust (vs 48%). Messages and policy positions tested against London sentiment may systematically misfire elsewhere.
This pattern is reinforced at the mindset level, which confirms it is not just a geographic artefact. AI-literate, AI-critical mindsets are fleeing to Green. AI-disengaged, low-trust mindsets are fleeing to Reform.
Where AI Anxiety Goes Depends on Trust in the State
about AI?69% of the public
still fixable?
Alarmed Populists
Disengaged Traditionalists
Pragmatic Sceptics
The Pragmatic Sceptics are the clearest example of the more trusting path. They are heavy AI users (82%), deeply concerned (81%), distrustful of government, but they still believe the system is fixable. 40% are now switching to Green, with Labour collapsing from 40% to 16% in this mindset. These are educated voters who understand the technology and want it governed, but have concluded Labour will not deliver. The Disengaged Traditionalists are the clearest example of the less trusting path. They barely use AI. 31% have tried it. They have lost faith in the establishment to govern it and have defaulted to Reform as the most anti-establishment vehicle available. Same anxiety, opposite destinations. The switch is trust.
5.1.2 The Pattern in Context: What the Trust Literature Tells Us
This tension about trust is not as unusual as it may first appear, with a long history within democratic theory. Pippa Norris’s critical citizens[30] and Cas Mudde’s populist distrust[31] literatures describe two populations that sit side by side in our Mindsets: one whose frustration is reformist and values-driven, whose trust is rebuildable through voice, fairness, and visible delivery on the things they care about; and another whose distrust is constitutive rather than performance-based. They found that it is very difficult to move this second group with better communications, because suspicion of elites is part of the political identity itself. Here, Onora O’Neill’s distinction between trust and trustworthiness[32] is the useful corrective: the task is not to engineer the sentiment, but to deserve it by doing what you said you would, being honest about what you have not, and making your reasoning checkable. Attempts to do the former through messaging or transparency dumps reliably backfire, and they backfire hardest with the already-distrusting cohort, who read each new campaign as further evidence of elite manipulation, and who also happen to be the voters mainstream parties are losing fastest.
The empirical record converges on a small number of levers that actually move the dial and rebuild trust in Government. The largest, in the OECD’s 2024 drivers survey[33], is the sense of having a voice: a 47-point trust gap separates citizens who feel they have a say from those who do not, dwarfing every demographic effect. Bauhr and Grimes’s analysis of more than 70 countries[34] finds the inverse lever: exposing problems without proposing a remedy or offering recourse leads to resignation, not accountability, and actively depresses both trust and political engagement. Tom Tyler’s procedural-justice work[35] fills in the operational detail: the four elements he identifies (whether people had a say, whether the decision-maker was neutral, whether they were treated with respect, and whether the motives behind the decision seemed honest) are the best-evidenced mechanism for generating legitimacy across very different publics, with randomised trials from policing to tax administration showing that fair process with recourse and accountability produces acceptance even of unfavourable outcomes. It is worth being precise about what “voice” means here, because it is often misread. The voice this literature rewards is voice at the point of encounter with the state: the appeal that is actually heard, the decision that can be contested, the officer who explains. That is distinct from voice-as-event (citizens’ assemblies, structured consultation, deliberative forums), where the evidence is much more mixed. These forums tend to skew towards the people already inclined to engage[37], and can deepen cynicism when they are ignored or staged[38]. They work as a retention tool for the trusting cohort rather than a recruitment tool for the distrusting one, and without binding remit and visible follow-through they become grist for the next grievance rather than a remedy to it. Each of these findings is consistent with what we already see in the segmentation: Pragmatic Sceptics want accountability they can watch; Disengaged Traditionalists want someone to make them comply. The same demand, routed through very different reservoirs of trust.
The sharper, harder lesson is that the two cohorts genuinely pull in opposing directions, and that without careful planning, strategies designed to chase one tend to widen the gap with the other. The cleanest recent comparator is the Danish Social Democrats[36]: a hard post-2015 turn on immigration collapsed the populist right at the ballot box, but bled their own pro-immigration voters to smaller left parties, a near-zero-sum manoeuvre that only worked because the coalition arithmetic happened to favour it. The read-across for Labour is direct. Splitting the difference through technocratic centrism tends to lose both flanks. More promising is to stand on the ground the cohorts already share, which our data maps clearly: near-universal demand for regulation, broad hostility to concentrated corporate power, and a consistent appetite for concrete, enforceable redress. Independent oversight with teeth and accessible appeal rights reads as “voice and dignity” to the Green-leaning cohort and as “we will make them comply, and you will have recourse” to the Reform-leaning one: the same policy doing two different political jobs. For both cohorts, this is the slow work of trustworthiness that, on the evidence, actually moves trust.
5.1.3 How to Begin Managing This
The political task, though, is narrower than the theoretical one: a governing party has to find concrete issues capable of holding a fragmenting coalition together. AI governance is one of the few areas where our data suggests this is still possible. The demand for stronger regulation is near-universal (85%), cutting across every mindset and every direction of defection. The anti-billionaire power frame is the only one tested that bridges the Green-Reform divide. And messages that name specific actors, identify concrete harms, and offer a clear remedy resonate across mindsets regardless of which direction a voter is drifting. The question for Labour is not whether it can survive mid-cycle blues, call it what you want; this is not a standard midterm, but whether it can identify the issues that reunite a fragmenting coalition before the fragmentation becomes permanent. AI policy, positioned correctly, is one such issue.
If distrust functions as a switch that routes AI anxiety towards Reform in some places and towards the Greens in others, advocates need to treat “trust in the state” as a precondition, not an assumption. In higher-distrust environments, disproportionately represented in the marginal-seat battleground, the weakest move is to lead with technocratic reassurance. An “AI will be regulated responsibly” pitch can land as fantasy, or as establishment reassurance from institutions people suspect are captured, slow, or simply not on their side. The more effective posture is to start where cynicism starts: power, fairness, and control. The frame becomes less “trust us” and more “we will make them comply, and you will have recourse when they don’t”, with concrete promises that people can picture: “we’ll make the tech giants pay”, “we’ll protect your job”, “we’ll stop rip-offs and surveillance”, “you will be in control”.
The logic flips in lower-distrust environments. People can still be anxious about AI, but they retain a basic belief that public power can set rules, if pushed, so advocates can afford to be more explicit about regulation and even “responsible innovation”. But the risk here is sounding too pro-business or too cosy with industry; this audience wants rules with teeth, not boosterism. A “responsible innovation” story only travels if it is visibly tethered to corporate accountability and enforcement: clear rules, independent oversight, and meaningful penalties for harm.
Across both terrains, it helps to be candid about what the opposition offer is doing rhetorically. In high-distrust regions, the story often used by Reform that “the elites are using AI against you” will feel intuitively plausible because it fits existing suspicions about competence and capture; the way to blunt it is not to dismiss it, but to make it harder to believe by putting forward protections that are enforceable and visibly targeted at concentrated power. The through-line is simple: treat trust as a variable. Where trust is low, build the case through control and enforcement rather than reassurance; where trust is higher, make the governance-and-innovation case, but keep corporate accountability as the spine of the offer.
5.2 The Marginal Seat Battleground
In the weighted sample, 16.8% of respondents live in a marginal constituency, defined here as a seat which was narrowly won by fewer than 3 percentage points at the last election. These are the places where small shifts in public opinion can change electoral outcomes, making their distinctive profile especially important because parties shape their choices around voters like these.
| Measure | Marginal Seats | Safe Seats |
|---|---|---|
| Reform tomorrow | 34% | 25% |
| Green tomorrow | 15% | 20% |
| Labour tomorrow | 15% | 17% |
| Very likely to vote | 78% | 73% |
| TV news daily | 45% | 35% |
| Social media for news: do not use | 42% | 32% |
Reform surges to 34% in marginal seats, nearly 10pp ahead of safe seats, while the Green surge that dominates the national picture is considerably weaker in marginals (15% vs 20% nationally). The mindsets most concentrated in marginal seats are the Uncertain Middle (21.2%) and Disengaged Traditionalists (20.6%); Pragmatic Sceptics (12.4%) are least represented.
Marginal seat residents consume notably more traditional media (45% watch TV news daily vs 35% in safe seats) and are less likely to use social media for news (42% do not use it vs 32%). This has direct implications for campaign strategy: messages that travel primarily through Reddit, TikTok, or Bluesky will systematically miss the marginal seat electorate.
On policy trade-offs, marginal seats are more protective than safe seats on children’s AI (+11pp), US dependency (+8pp), copyright (+5pp), and regulation (+3pp); however, they are notably more permissive on Digital ID (-9pp). NHS data sharing is essentially a dead heat in marginals (vs +8pp anti-share in safe seats), creating a specific local dynamic where the issue is genuinely contested rather than settled.
The picture is clear: the battleground electorate is more Reform-leaning, more traditionally media-consuming, and more protective on children’s and sovereignty questions than the country at large. AI policy advocates operating primarily in metropolitan, digitally-native, Green-leaning environments are designing for the wrong audience if marginal seats are the target.
5.3 NHS Data Sharing
This issue is radioactive, and the narrowest margin in our trade-off battery. Respondents chose between sharing anonymised NHS data with trusted researchers and companies to develop treatments, or blocking any sharing with private companies due to risks of misuse and privacy loss. The pro-sharing option was deliberately framed with its strongest case: anonymised, trusted partners, better care. Even so, the public tilts against: 48% opposed, 41% in favour. On five of our six trade-offs, the protective option wins decisively (typically 67–78%). NHS data sharing is the outlier where the country remains genuinely divided, and where the political risk is highest.
| Mindset | Share Data | Do not Share | Net | Political Implication |
|---|---|---|---|---|
| Market Optimists | 71% | 24% | +47pp | Safe to support sharing |
| Hopeful Regulators | 46% | 42% | +3pp | Lean pro-share |
| Pragmatic Sceptics | 42% | 50% | -8pp | Lean anti-share |
| Uncertain Middle | 22% | 50% | -28pp | Anti-share, 28% unsure |
| Alarmed Populists | 23% | 69% | -46pp | Strongly anti-share |
| Disengaged Traditionalists | 40% | 47% | -7pp | Lean anti-share |
5.3.1 NHS Voter Dynamics
Labour’s current voters (tomorrow’s intention) are +14pp pro-share, more than any other party’s voters. However, Labour’s 2024 voters were essentially neutral (net +0pp). This means:
- Labour is haemorrhaging its voters sceptical of NHS data sharing to Green (-19pp anti-share) and to a lesser extent Reform (-8pp anti-share)
- The voters Labour is retaining are those more comfortable with private sector involvement in healthcare
There is also an intensity asymmetry that makes this risk lopsided. Roughly a quarter (27%) strongly oppose sharing, compared with about one in ten (11%) who strongly support it. Even where the topline is closely divided, the emotional energy is not. That usually means the political penalty for the “wrong” pro-sharing signal is higher than the penalty for a cautious or qualified stance: the opponents are more motivated, more suspicious, and more likely to punish you.
If Labour openly backs NHS data sharing, it may reassure its pro-innovation base, but it also hands opponents their cleanest wedge and most effective line of attack, “Labour is privatising the NHS”, making it harder to win back Green/Reform defectors. This is not a “pick a side” issue but one to manage by shifting the argument away from ‘share or do not share’ and towards the conditions for acceptable use by foregrounding patient consent and control, robust independent oversight, tight limits on commercial use, and enforceable, visible penalties for misuse. Where possible, the decision should sit with regulators and governance mechanisms rather than partisan signalling, because once it becomes a cultural identity cue, Labour will lose the ability to hold a broad coalition.
6.
Digital
Sovereignty

Section 4.1 established that the British public is decisively protective on the question of US dependency (+54pp) and that “US AI technology companies” carry a measurable trust penalty relative to generic “AI companies” (Section 4.3) when ranked alongside each other. But how people feel about sovereignty in the abstract is different from what happens when a specific competitor is named. To test this, the survey split the sample into three randomised groups, each receiving a different version of the same question:
- SSA (neutral): “How important is it to you that the United Kingdom develop its own artificial-intelligence capabilities?”
- SSB (US frame): “...rather than relying on technologies from the United States?”
- SSC (China frame): “...before China does?”
This design isolates the effect of competitive framing. The question is identical; only the geopolitical anchor changes. In a parallel US study, we found that invoking China made working-class populist mindsets notably more supportive of domestic AI investment, while the same framing demotivated free-market business voters. The UK results replicate this structural pattern, but with the countries inverted.
6.1 The US Frame Motivates; the China Frame Polarises
The topline results show a clear hierarchy:
| Response | SSA (neutral) | SSB (US frame) | SSC (China frame) |
|---|---|---|---|
| Extremely important | 25% | 34% | 32% |
| Very important | 28% | 29% | 23% |
| Moderately important | 20% | 19% | 18% |
| Slightly important | 10% | 7% | 8% |
| Not very important at all | 7% | 5% | 10% |
| Not sure | 9% | 7% | 9% |
| Top-2 box (the combined percentage choosing ‘Extremely important’ or ‘Very important’) | 53% | 63% (+10pp) | 55% (+2pp) |
Mentioning the United States motivates the whole public towards caring more. In other words, framing AI capability as a question of dependence on America makes more people feel it matters, and feel it more strongly. It does not just move people into the top two categories; it pulls from every level below. ‘Slightly important’ drops from 10% to 7%, ‘Not very important’ from 7% to 5%, and ‘Not sure’ from 9% to 7%.
The China frame does something structurally different: it polarises. “Extremely important” rises sharply (25% to 32%), but “Very important” drops (28% to 23%), and “Not very important at all” actually increases (7% to 10%). People who already care become more intense; people who do not care actively reject the premise. The top-2 box gain of +2pp is modest because the top is gaining while the bottom is also growing; the middle is being hollowed out.
6.2 Mindset Dynamics: Who Responds to Which Competitor
The “Extremely important” response, the strongest measure of conviction, reveals sharply divergent mindset-level reactions:
| Mindset | SSA (neutral) | SSB (US frame) | SSC (China frame) | US lift | China lift |
|---|---|---|---|---|---|
| Market Optimists | 31% | 28% | 27% | -3pp | -4pp |
| Hopeful Regulators | 34% | 37% | 49% | +3pp | +15pp |
| Pragmatic Sceptics | 17% | 26% | 18% | +9pp | +1pp |
| Uncertain Middle | 11% | 13% | 15% | +2pp | +4pp |
| Disengaged Traditionalists | 28% | 44% | 39% | +16pp | +11pp |
| Alarmed Populists | 23% | 45% | 36% | +22pp | +13pp |
Three patterns are strategically meaningful:
The populist and traditionalist mindsets respond most intensely to the US frame. Alarmed Populists jump from 23% to 45% (+22pp) and Disengaged Traditionalists from 28% to 44% (+16pp). These are the two mindsets most concentrated in marginal seats (Section 5.2) and most likely to be flowing towards Reform. The idea that Britain is dependent on American technology, from offices to the NHS and the financial system, is viscerally motivating for them in a way that abstract Chinese competition is not.
Hopeful Regulators are the one mindset where the China frame dramatically outperforms. Their “Extremely important” rate surges from 34% to 49% under the China frame (+15pp), compared to just +3pp under the US frame. This pro-governance, centre-left mindset reads “before China does” as a safety and governance imperative, a reason to build robust institutions, rather than as a nationalist provocation.
Market Optimists show no lift under either competitive frame. They are the only mindset where invoking a competitor does not raise conviction. Their small movements (-3pp under the US frame, -4pp under the China frame) sit within sampling error, so this reads as the absence of a positive effect rather than active backlash. It fits their profile as free-market internationalists motivated to pursue the technology for commercial opportunity rather than geopolitical advantage, and it mirrors the US finding, where business-oriented mindsets resisted China-framing for analogous reasons.
6.3 How Sovereignty Impacts Voters
The most consequential dimension is how these framing effects interact with electoral realignment. The Labour collapse documented in Section 5.2 is sending voters in two directions, towards Reform and towards the Greens, and the split-test reveals that each destination responds to a different geopolitical frame.
Past vote (2024), top-2 box:
| 2024 Vote | SSA (neutral) | SSB (US frame) | SSC (China frame) | US lift | China lift |
|---|---|---|---|---|---|
| Conservative | 59% | 69% | 70% | +10pp | +11pp |
| Labour | 60% | 69% | 60% | +9pp | ±0pp |
| Reform UK | 50% | 64% | 70% | +14pp | +20pp |
| Green | 39% | 59% | 31% | +20pp | -8pp |
Current intention (tomorrow), top-2 box:
| Intention | SSA (neutral) | SSB (US frame) | SSC (China frame) | US lift | China lift |
|---|---|---|---|---|---|
| Conservative | 56% | 69% | 63% | +13pp | +7pp |
| Labour | 65% | 71% | 69% | +6pp | +4pp |
| Reform UK | 53% | 57% | 69% | +4pp | +16pp |
| Green | 37% | 57% | 34% | +20pp | -3pp |
The patterns are stark:
Reform voters respond to the China frame; Green voters respond to the US frame, and they move in opposite directions. Among 2024 Green voters, the US frame lifts support by 20pp, the largest single framing effect in the dataset, while the China frame actually depresses support by 8pp. Among 2024 Reform voters, it is the China frame that produces the strongest response (+20pp), with the US frame also effective but secondary (+14pp). These are structurally different reactions, not just stronger or weaker versions of the same one: one group is motivated by the prospect of American technological dependency; the other by Chinese strategic competition. Mentioning the wrong competitor to the wrong audience does not just fail; it backfires.
Conservative voters respond to both frames, but the China frame edges ahead among 2024 Conservatives (+11pp vs +10pp). This is the party’s traditional national security constituency, and the finding is consistent with their disposition: geopolitical competition of any kind motivates them, but the more familiar Cold War-adjacent framing of Chinese rivalry has a slight edge.
Labour’s former voters respond primarily to the US frame (+9pp), with the China frame doing almost nothing (±0pp). But among current Labour intenders, the smaller, more committed rump who have not yet defected, the gap narrows substantially (US +6pp, China +4pp). The implication is that the voters Labour has already lost were more responsive to the anti-US-dependency frame than the voters it has retained. The sovereignty-minded, populist-leaning Labour defectors documented in Section 5.2 are precisely the people who respond most to the idea that Britain should not be dependent on American technology.
The same split shows up in how strongly people feel, not just whether they agree. Among those currently thinking of voting for Reform, the share calling AI sovereignty ‘extremely important’ jumps from 24.1% to 47.5% under the China frame, nearly doubling. Among those currently leaning Green, the US frame lifts that ‘extremely important’ share from 12.1% to 28.5%, while the China frame leaves it flat at 13.2%. Competitive framing does not just change whether people care; it changes how deeply they care, and in electorally divergent directions.
6.4 What This Means for Political Messaging
The split-test findings have direct implications for how digital sovereignty is communicated.
The +54pp protective margin on US dependency (Section 4.1) is real, but it masks a compositional story. The public agrees on the destination, that Britain should not be dependent on foreign AI, but different electoral coalitions arrive there through different motivational pathways.
The qualitative work adds a lived register. In the rooms, US dependency was not abstract. Participants named it in specific terms, closer to a values-and-power critique than to nationalism. Nisha, an NHS data analyst in Leeds, refused the anti-American framing: “it’s anti… anti a particular approach to how technology and power work, that happens to be most concentrated in California at the moment.” Linda, a grandmother in Birmingham, pinned it to specific values: “they are created in an American way with their own values, which may not be the same as ours… I don’t think Mr. Trump shares my values.” The concept most participants reached for first was not “American” but “the Silicon Valley model”, shorthand for concentrated capital, extractive commercial terms, and values they did not recognise as their own. Lead with values and power because the audience is already there. Lead only with “American”, and you will concede the framing to Reform.
The US dependency frame is the broadest mobiliser because it draws from the largest and most diverse pool of persuadable voters: Labour defectors, Green-leaning progressives, and the younger, more internationally minded cohort who experience American technology platforms as the immediate and tangible form of foreign AI influence in their lives.
The China frame is narrower but more intense. It activates national security instincts and maps onto an existing geopolitical narrative that is comfortable terrain for Conservative and Reform voters. But it comes at a cost: it alienates Green-leaning voters, increases rejection among some cohorts, and hollows out the moderate middle. In a political landscape where Labour needs to hold both its progressive and populist flanks, the China frame is a wedge that splits the very coalition it needs to reassemble.
For advocates seeking to build the broadest possible coalition for UK AI sovereignty, the data points in one direction: lead with American dependency, not Chinese competition. The US frame produces a +10pp national lift with no measurable backlash among any mindset or party. The China frame produces a +2pp net lift that comes loaded with a polarisation cost. In marginal seats, where elections are decided, the US frame lifts by +9pp while the China frame produces a negligible +1pp with a rising rejection rate (bottom-2 box increases from 15% to 20%).
This finding also connects to the trust data in Section 4.3. “US AI technology companies” already carry a 5-point penalty on favourable share (and a 9-point net penalty, Section 4.3) relative to generic “AI companies.” The split-test shows that this suspicion is not passive; it is electorally activatable. When sovereignty is framed as a question about American dependency rather than Chinese competition, it converts latent distrust into active support for UK AI development, and it does so across the partisan spectrum rather than within it.
6.5 The “US Company” Label Effect
We also asked people how favourably they viewed AI companies. When that same question changes just two words, from “AI Technology Companies” to “US AI Technology Companies,” sentiment drops notably across every mindset. The chart below shows this A/B comparison.
The audiences most activated by the US dependency frame, Alarmed Populists (+22pp) and Disengaged Traditionalists (+16pp), are also the audiences who, as the next section shows, are most likely to conceptualise AI through MYTHICAL and INAUTHENTIC lenses: as something fraudulent, supernatural, or fundamentally beyond human control. This is not a coincidence. The US dependency frame succeeds with these groups precisely because it converts an abstract technology into a concrete power relationship, American corporations controlling British infrastructure, and that concreteness maps onto the metaphorical frameworks through which they already interpret the technology. Understanding those frameworks is the subject of Section 7.
6.6 The Sovereignty Bridge and the Resignation Sink
Why does the US-dependency frame so effectively convert latent distrust into active support? One way to surface the answer is to map the architecture of belief beneath the messages. A Hierarchical Value Map (HVM) is a market-research technique for tracing how people get from a concrete thing, like an AI product or a policy or a news story, up through what it does, how it makes them feel, and what is ultimately at stake. The chains are extracted from focus-group transcripts by laddering: asking why a claim matters, then asking again, until the answer lands at a deeply held value. To organise the analysis, we sorted the 48 participants by what each said in the room about whether action on AI was still possible: Activated (the participant believes institutional action is possible and worth demanding) or Resigned (the participant believes action will not come, that it is too late or the system is captured). All 282 chains were then mapped by classification (Reynolds and Gutman, 1988[39]; full methodology in Section 10.2.5), revealing two regions pulling in opposite directions with significant implications.
How Underlying Values Pull People Towards Action or Resignation
Hierarchical Value Map of 282 means-end chains from 48 focus-group participants, classified by stance on whether institutional action is still possible
The Sovereignty Bridge runs up the right of the map. At the attributes tier (the concrete things participants reached for), the chain begins with “the rich and powerful”, “our books and music”, and “training data missing people like me”. These feed up to the functional tier (what those things are seen to do in the world): “industry writes the rules”, “loss of sovereignty”, and “nothing gets done”. At the emotional tier (how that situation feels), the chain runs through “no trust from inside”, “community falling apart”, and “why don’t we have our own?”. And it terminates at the values tier (what people believe is ultimately at stake) with “British values and sovereignty” and “visible institutional action”. Every node on this chain leans strongly Activated. Participants who articulate sovereignty concerns are already on a path towards demanding institutional response: the chain has the three features that make a message actionable. An external antagonist (them), a positive value endpoint, and a credible institutional remedy.
The Resignation Sink runs up the left. At the attributes tier it begins with “AI”, “ChatGPT”, and “robots doing surgery”. At the functional tier, “machines outrunning us” and “can’t tell what’s real”. At the emotional tier, “dread”, “exhausted”, “scared”, and “giving up”. And at the values tier it terminates at “agency over my life”. Every node on this chain leans Resigned. The terminal value sounds aspirational in isolation, but in this corpus it appears only as the vocabulary of loss: every ladder reaching it is a ladder describing things slipping out of personal control, not a ladder demanding they be wrested back. The antagonist is diffuse (AI in general), the emotional endpoint is private withdrawal, and no institutional action is visible from inside the chain. The same emotional energy that the bridge converts into demand, the sink consumes as despair, leaving the listener paralysed, disengaged, and passive.
The rule is symmetric: embrace the bridge, avoid the sink. The two chains are not arguments to be won against each other; they are routes through which the same emotional energy can travel. Two opposite instincts both lead the wrong way. The first is to refute the despair frame, to talk people out of their fear of AI. The second is to lean into it, to use its emotional resonance to drive engagement on the assumption that any feeling counts as participation. If the goal is civic participation and durable public support, both routes dead-end at the sink. The intervention is redirection. Name the antagonist the sink is missing, and the emotional energy that would otherwise sit in private dread climbs to public demand instead. This is the structural reason the US dependency messaging in 6.4 outperforms the existential risk messaging in 8.1: the former opens onto an Activated architecture; the latter dead-ends inside a Resigned one.
For those working in policy and communications, the rule has three practical applications. Lead with the antagonist before the harm. A message that names “billionaire tech CEOs” or “the rich and powerful” before describing what AI does keeps the listener on the bridge. Avoid AI-as-actor framings. “AI is taking your job” routes the listener into the sink because there is no antagonist to demand action against. Pair every sovereignty claim with a competence claim. “They are building it about us, not for us” lands hardest when it is followed immediately by an institutional remedy the listener can picture. The bridge needs both rails to carry the load.
7.
Narrative
Frames

The previous sections examined what the public thinks about AI: their concerns, policy preferences, and voting behaviour. This section asks how the public conceptualises it. When people explain something as large and abstract as artificial intelligence, they reach for metaphors, converting the unfamiliar into the tangible. These metaphors are not decorative. They shape how people reason about risk, agency, and control. By examining which metaphors people choose, we can identify the assumptions they hold and the messages they are most likely to respond to.
We asked all 2,911 respondents an open-ended question: “Imagine you were trying to explain artificial intelligence (AI) to a friend who doesn’t really know much about it. In your own words, how would you describe AI, what it does, what it might mean for us all?” Responses were systematically coded for metaphorical language using an established academic framework (Stone, 2024)[20], categorising them into 50 distinct types of figurative description.
This is the first application of the Narrative Frames methodology to nationally representative public opinion data. Stone (2024)[20] previously applied the framework to elite discourse (political speeches, parliamentary hearings, and public comments across the US, UK, and EU), where it revealed that political leaders and advocates systematically rely on JOURNEY, WAR, and BUILDING frames when discussing AI governance. The UK public, it turns out, thinks in entirely different terms.
Of the 2,911 respondents, 2,758 (94.7%) provided responses that could be coded. The vast majority used figurative language; just 6.3% gave purely literal descriptions. Four frames dominate:
- BODY (23.8%): AI conceptualised through human cognition: brains, minds, thinking, learning. One respondent described AI as “an artificial thinking tool which is in many ways very similar to a human brain but operating much faster and with wider scope.” Another put it simply: “Computers trying to be human.”
- MACHINE (21.9%): AI as tool, system, infrastructure. “It’s like autocorrect, only on a much larger scale.” Or, more bluntly: “It’s really high performance computing using complex algorithms. There is no such thing as Artificial Intelligence.”
- MYTHICAL (10.8%): AI as supernatural, science-fictional, beyond human control. “You’re playing with fire. Terminator.” At the more measured end: “It is not sentient. Yet.”
- INAUTHENTIC (8.2%): AI as fake, deceptive, not real. “Something that looks and sounds real but isn’t.” Or simply: “Unreal imitations of everything!”
Three further frames appear at lower frequencies but prove analytically meaningful: POWER AND HIERARCHY (7.5%), where AI is understood through workplace and social structures (“It is like having a digital assistant, or junior helper”); RELATIONSHIPS (5.3%), where AI is a conversational partner or companion (“It’s like having a friend who’s an expert in everything”); and ANIMAL (4.2%), where AI is a creature to be fed and managed (“a tool that has been fed lots and lots of information from various sources”).
Notably, JOURNEY (2.3%), WAR (2.3%), and BUILDING (0.4%), the three most prevalent frames in UK political speech, barely register with the public. What follows breaks these frames down by mindset and demographic group.
7.1 Mindset-Level Framing: Each Audience Thinks About AI Differently
The attitudinal mindsets identified in Section 3 do not merely hold different opinions about AI; they conceptualise it through fundamentally different metaphors. Reaching each audience requires a different conceptual entry point, not just a different message.
Each mindset profile tells a coherent story:
Market Optimists see a machine. Their dominant frame is MACHINE (31%), the most instrumentalist worldview in the sample. AI is a tool you use, a system that works, a technology to be optimised. As one respondent put it, “Imagine Google, but it can do anything.” Their low MYTHICAL (6%) and negligible WAR (0%) confirm they see nothing threatening. They are the only mindset with measurable JOURNEY framing (5%), suggesting some engagement with the elite discourse of “paths forward.” The risk: by seeing AI as a tool rather than a power structure, Market Optimists may systematically underestimate questions of who benefits and who loses.
Hopeful Regulators think about power and relationships. They have the highest POWER AND HIERARCHY (11%) and RELATIONSHIPS (12%) of any mindset. These are people who see AI as a social arrangement: who has power, who is affected, how relationships between humans and AI should be structured. When this mindset describes AI, it sounds like this: “It’s like having a sensible, adult conversation with an expert in whatever topic you choose.” Their framing is more political and relational than any other mindset, which explains their support for strong regulation paired with openness to AI’s potential. They respond to governance language because they already think in governance terms.
Pragmatic Sceptics see a machine, and an animal. Their leading frames are MACHINE (28%) and BODY (25%), but they uniquely over-index on ANIMAL (10%), more than double any other mindset. The Animal frame conceptualises AI as something fed and cultivated by its keepers, “a computer system which is fed data by humans,” alive, somewhat unpredictable, potentially dangerous but also potentially trainable. With 82% AI usage, this is not naivety; it is informed wariness. The Animal metaphor positions the regulator as a handler managing something that could bite, rather than a bureaucrat issuing guidelines, which may explain why Pragmatic Sceptics respond strongly to the Independent Regulator message (77.0, Section 8).
Alarmed Populists live in a mythical world. Their MYTHICAL framing (18%) is over one and a half times the national average, the highest of any mindset. They are the only mindset where MACHINE is not in the top two. This is a public that sees AI through science-fiction narratives: “robots running the world,” autonomous intelligence, runaway technology. Their fears are about existential loss of control, not specific policy failures, which aligns with their near-universal concern (97%) and near-zero trust in government (3%). Rational, technocratic messaging lands in the wrong conceptual space entirely. What they need is visible, dramatic evidence that humans are in charge. Not reassurance. Demonstration.
Disengaged Traditionalists see something fake. Their standout frame is INAUTHENTIC (15%), nearly double the national average and three to four times higher than most mindsets. They also have the highest NON-METAPHORIC responses (11%), meaning many struggle to conceptualise AI through any lens at all. With low AI usage (31%) and advanced age (67% over 55), this is a public that has not engaged with AI enough to form a vivid mental model. What they do see, they dismiss: “fake news and doctored pictures.” Their Machine framing is among the lowest (17%); they do not even grant AI the status of a useful tool. This mindset will likely only engage when AI’s impacts become tangible in daily life, when the metaphor shifts from “that fake thing” to “the thing that changed my energy bill.”
The Uncertain Middle does not have a settled metaphor. Their highest frame is MACHINE (22%), but their distinctive feature is diversity: the highest RELATIONSHIPS (14%) and the highest NON-METAPHORIC (12%) of any non-Disengaged mindset. They are the metaphorical equivalent of undecided voters, reaching in multiple directions without committing. This fits their profile as genuine “don’t knows” (Section 3) and explains why all five tested messages scored lowest with this mindset (Section 8): you cannot persuade people whose mental model is still under construction. Experiential engagement, actually using AI tools, may do more to shift this mindset than any message.
7.2 The Elite-Public Metaphor Gap
The metaphor gap runs deeper than the mindsets. Coded with the same framework, a second corpus of how elite audiences talk about AI in public comes out almost as the public’s mirror image. It draws on parliamentary debate, statements from executives and the head of state, civil service material, industry testimony, and advocacy and academic writing, and its frames barely overlap with the public’s.
The public starts from the concrete. Its two leading frames are BODY (23.8%) and MACHINE (21.9%). People picture AI as a mind, sometimes a whole body: a brain that learns and relates, a kind of person. Or as a machine: a tool, a system you can operate or switch off. Elites use both far less (BODY 5%, MACHINE 8%). They reach instead for JOURNEY. The public uses journey language for about 2% of its metaphors; for elites it is the most common frame they have, around 19%, AI as a road to travel with the next milestone up ahead.
Just as telling is a frame the public almost never reaches for: RACE. A journey is a road you walk; a race is a contest someone is about to win. About 6% of elite metaphors take this competitive form, against almost none of the public’s, and it is the defining frame of industry speakers, who use it more than any other. The resemblance is the trap: a journey and a race both move forward, so to a listener they can sound like the same thing, but a journey invites you to travel along while a race says hurry, before a rival gets there first. That difference is why the two are worth separating, because the race frame carries an urgency and a winner-takes-all logic that the journey frame does not.
The sharpest gap is the one elites leave empty. Not one elite instance framed AI as POWER AND STATUS, the language of who controls whom and who becomes the new elite class. Among the public that frame runs to around 8%. The public reads AI as a question of power first: whether it puts control into fewer hands, and whose job goes when it arrives. The people who hold that power never describe AI that way. There is something telling in the silence.
This is the conceptual root of the strategic-communication problem in Section 7.4. When a minister says the country is “charting a responsible course on AI,” nobody in the public is walking that road with them. They are picturing brains, machines and fakes, and wondering who will end up in charge of them.
The public and elite figures come from two studies that share one codebook. The elite corpus is small, 465 coded instances across six audiences, so the comparison is directional. The inversion itself, the public toward Body and Machine while elites go to Journey, is the solid finding.
7.3 Demographic Patterns in Framing
Several demographic patterns reinforce and extend findings from earlier sections.
Gender. Women are much more likely to use INAUTHENTIC framing (10.2% vs 6.1%) and MYTHICAL framing (12.4% vs 9.1%), while men over-index on BODY (27.3% vs 20.4%) and MACHINE (23.0% vs 20.7%). Women’s higher NON-METAPHORIC rate (8.2% vs 4.2%) also suggests less conceptual engagement with AI, consistent with the gender gap in usage (Section 2.1). The combination, simultaneously dismissive and frightened, aligns with their higher concern across every risk category (Section 4.2) and higher rate of vote indecision (16.5% Do not Know). This is an uncomfortable cognitive position that technocratic messaging is unlikely to resolve.
Age. The 55+ cohort has dramatically higher INAUTHENTIC framing (14.9%), nearly four times the rate among 18–24 year-olds (4.1%). Younger respondents over-index on ANIMAL (9.8% vs 2.3%) and MACHINE (26.0% vs 20.2%). The generational gap in conceptualisation maps onto the engagement gap: younger people who use AI regularly think of it as a powerful tool or an unpredictable creature; older people who have not used it think of it as a fraud.
Education. University graduates lean heavily towards MACHINE (27.2%) and BODY (27.7%), with low INAUTHENTIC (5.5%). Those who left school at 16 have the highest INAUTHENTIC (12.0%) and NON-METAPHORIC (9.5%) rates. Education appears to provide the conceptual vocabulary for engaging with AI metaphorically, though as documented in Section 3.3.3, this engagement does not reduce anxiety.
Ethnicity. Black, Asian, and other ethnic minority respondents use more MYTHICAL framing (13.2% vs 10.3% White) and more BODY framing (26.3% vs 23.5%), with notably lower INAUTHENTIC (4.3% vs 8.9%). This is consistent with their higher AI engagement and excitement (Section 2.5): they engage with AI enough to conceptualise it vividly, gravitating towards embodied and imaginative frames rather than dismissive ones.
Vote choice. The sharpest political divergence is in INAUTHENTIC framing. Reform voters have the highest rate (13.7%), followed by Green (9.0%), Conservative (8.2%), and Labour (7.2%). Reform voters also have elevated MYTHICAL framing (12.7%) and lower MACHINE framing (18.0%): they are less likely to see AI as a controllable tool and more likely to see it as fake or frightening.
The Reform–Green comparison is instructive. Both groups have defected from Labour. Both want stronger rules. But they arrive at that demand through entirely different conceptual pathways. Reform voters frame AI as INAUTHENTIC + MYTHICAL: suspicious, unknowable. Green voters frame it as MACHINE + POLICING: controllable, regulatable. Green voters uniquely over-index on POLICING (6.9%), conceptualising AI through law enforcement and accountability, consistent with their demand for regulatory institutions with teeth. The metaphorical gap between these two groups is as wide as the political one, mirroring the divergence documented in Section 5.2.
7.4 What This Means for Strategic Communication
The narrative frames data reveals the conceptual infrastructure through which persuasion must travel. Four implications follow:
- Politicians are speaking a language the public does not use. JOURNEY (“a path forward,” “the next step,” “charting our course”) is the single most common way elite audiences discuss AI, around a fifth of their metaphors (Section 7.2). Among the public, it accounts for just 2.3% of metaphorical language. When a minister says “we are charting a responsible course on AI,” the public is not walking alongside them. They are thinking about brains, monsters, fakes, and machines. Anyone hoping to persuade must start in the public’s metaphorical world, not the policymaker’s.
- The MACHINE frame is the most politically useful. MACHINE (21.9%) frames AI as a designed system, something that can be regulated, redesigned, or switched off. This is the conceptual territory where policy intervention feels most natural, and where the Independent Regulator message (72.7/100, Section 8) already operates. But it competes with the dominant BODY frame (23.8%), which humanises AI and makes regulation feel less intuitive: you cannot regulate a brain; you can only fear it, reason with it, or defer to it. Consistent messaging that positions AI as designed infrastructure rather than quasi-human intelligence could shift more of the public towards ground where regulatory arguments land.
- The INAUTHENTIC frame has untapped strategic potential. At 8.2%, this frame captures a distinctively sceptical response, less “AI will destroy us” and more “AI is nonsense pretending to be clever.” It is concentrated among groups that are hardest to reach: older, less educated, Reform-leaning. No political actor currently uses it. Positioning AI regulation as protecting people from corporate hype and snake oil, rather than managing an existential threat, could open a door to an audience that currently dismisses the entire conversation.
- Each mindset needs a different conceptual entry point. The Machine frame reaches Market Optimists and Pragmatic Sceptics. The Mythical frame reaches Alarmed Populists, but requires visible demonstrations of control rather than technocratic reassurance. The Inauthentic frame dominates among Disengaged Traditionalists, who will only engage when AI’s impacts become concrete. The Relationships and Power frames reach Hopeful Regulators, who already think in governance terms. One-size-fits-all communication on AI is conceptually impossible.
This finding extends the “two directions of travel” analysis in Section 5.1. The public is splitting conceptually as well as politically: INAUTHENTIC/MYTHICAL (fearful, suspicious, dismissive) on one side, MACHINE/POLICING (rational, governance-oriented, instrumentalist) on the other. The distrust switch documented earlier does not just determine where AI anxiety goes politically; it determines how AI is understood cognitively. Where trust is low, AI is a con or a monster. Where trust is higher, AI is a machine that can be governed. Communication strategy must account for both the political destination and the conceptual starting point.
If these metaphorical frameworks define the conceptual ground on which persuasion must operate, the practical question becomes: which messages actually succeed in moving opinion, and do they succeed because they meet people within their existing frames? Section 8 puts this to the test, using real-time dial tracking to measure how five policy messages perform, moment by moment, across the same mindsets whose conceptual worlds we have just mapped.
8.
Messaging
& Testing
Throughout this research, we dial-tested five messages to understand not just whether people find them persuasive, but when and why. Respondents listened to audio recordings of each message and used a dial to rate their reaction continuously on a 0–100 persuasiveness scale, moment by moment, as the message played. This captures unprimed, instinctive responses at the point of exposure, before people have time to rationalise or second-guess. By identifying the peaks and troughs within each message, we can isolate which specific phrases, arguments, and framings land in real time, and which ones lose people.
The British public’s three most acute AI concerns, loss of jobs (74%), impact on personal freedom (57%), and erosion of mental well-being (59%), provide the backdrop against which these messages were heard. The messages that performed best connected directly to these concerns; those that stayed abstract failed to land.
Each message framed the case for AI policy through a different lens:
- Independent Regulator (AISI): Keeping Britain’s digital infrastructure safe: give AISI statutory independence and legal powers to test, audit, and switch off unsafe systems
- Copyright: Protecting the foundations of British creativity: require consent and payment before AI companies use people’s work
- Workers: Build the future with us, not against us: require workers and unions to have a seat at the table
- Long-term: Preventing runaway risks from AI: keep AI under human control and build safeguards now
- Innovation and Growth: Turning the UK into a leader for trusted AI: an agile, pro-innovation approach with clear risk-based rules
📈 Explore the full dial-test results interactively
Break down each message by demographics, listen to the audio, and see performance over time in our interactive tool.
Explore8.1 Dial Testing Results
Five messages were tested on a 0–100 persuasiveness scale across the full weighted sample. After listening, respondents also rated each message in a considered post-exposure assessment, allowing us to measure the shift between instinctive and reflective reactions.
The real-time dial captures unprimed, instinctive responses as people listen, before they have time to rationalise or second-guess. Scores run on a 0–100 scale, where 50 represents neutrality: above 50 indicates support, below 50 indicates opposition. The post-exposure scores shown in Figure 63 are a separate instrument, a considered persuasiveness rating given after the message has ended and the respondent has had time to reflect. Where these two measures diverge, the gap is analytically significant. Throughout this section, dial scores are reported to one decimal place from the continuous trace; post-exposure scores are rounded integers from the separate assessment.
Independent Regulator (AISI): broad consensus, built through the argument. The dial shows broad support for the opening premise, safe, reliable, publicly monitored infrastructure, and shared concern about the risks of adding AI to existing systems. The mindsets most critical to winning show sharper concern: at the 22-second mark, Alarmed Populists (52.7), Disengaged Traditionalists (53.5), and the Uncertain Middle (54.6) all register lower scores than Market Optimists (56.2) and Hopeful Regulators (57.1). But as the message reaches the specific proposal, an independent regulator with legal powers to test, audit, and switch off unsafe systems, support builds uniformly across every mindset. Between the 30- and 42-second marks, every mindset climbs 11–18 points, and the spread narrows from 8.1 to 2.7 points. No other moment in any message produces this degree of compressed acceleration. The final dialled scores converge: Market Optimists at 72.6, Hopeful Regulators at 72.6, and the total sample at 72.2, with even Disengaged Traditionalists finishing at 72.1. A concrete policy prescription that compresses mindset differences rather than widening them points to a broad appetite for institutional solutions.
In the post-exposure assessment (Figure 63), the message performs even more strongly with engaged sceptics: Pragmatic Sceptics score it at 77 and Alarmed Populists at 79. This is a message that starts with a concern many people already feel and resolves it with something concrete and institutional.
The Independent Regulator message is doing something right. Every mindset climbs towards support on the dial, and the focus groups show why: it articulates a demand that is already broadly held. A strong, independent regulator is what every session asked for, in every political register, including from voters moving towards Reform.
In the non-expert rooms, largely made up of the Uncertain Middle and Alarmed Populists, the call came unprompted and in plain English. Gary wanted action made visible: “anything that has an AI image on it, it says clearly, like a packet of cigarettes: ‘This was created by AI.’ And the government should make sure it happens, like with food labels.” Margaret, a retiree, framed the trust question bluntly: government “on their own, absolutely not. I don’t think that they can regulate anything. But they should bring in experts and give them the power to act for us.” Christine, using ChatGPT for SEN advocacy, named the competence test: “[we need decision-makers] who are quite knowledgeable in, you know, matters of data sensitivity.” None used the words “audit” or “switch off.” They were asking for the same thing.
In the professional rooms, largely made up of Hopeful Regulators and Pragmatic Sceptics, the same demand arrived in the Independent Regulator message’s own vocabulary. Rory, who runs a children’s mental-health service in NHS Scotland, said: “This is basically what I do. It’s the language I’d use at work. Describing AI as infrastructure, as if it’s a type of plumbing, is exactly right. And the power to switch off, that’s what’s missing at the moment.”
The technical end of the audience was sharper. Deepak, a senior engineer at a tech firm, called “audit” a category error. He proposed a rewrite: “mandate specific evaluation testing, require public incident reporting, and order system withdrawal following verified harm.” The closer model is aviation safety, not financial audit.
The 70.4 topline reflects broad, cross-mindset agreement: on the need for strong, independent regulation, the country is largely aligned. The wording may invite hair-splitting by the technical experts, but the substantive case carries every mindset.
Copyright: the strongest shift, with convergence from opposing priors. The dial shows a softer but still broad consensus around protecting creators’ rights, with concern that existing protections are not being upheld. Disengaged Traditionalists register the sharpest concern at the 22-second mark. The most striking moment comes as the message reaches “that’s not progress; it’s robbery”: the total sample surges 11.6 points in eight seconds, the steepest single climb across all five messages. That blunt moral judgement converts a diffuse sense of unfairness into sharp conviction. At the final dialled score, Market Optimists (75.5) and Pragmatic Sceptics (75.6), the two mindsets with the most opposing priors on business and regulation, converge at the top. A pattern not seen elsewhere in the data: the copyright framing transcends the usual ideological divides.
On reflection, the considered scores climb further still. Copyright is the only message where both Alarmed Populists (84) and Pragmatic Sceptics (83) exceed 80, and together these mindsets account for over a third of the electorate. A strong score reflects both the quality of the framing and the salience of the underlying concern. What the data confirms is that naming specific actors, identifying a relatable harm, and offering a clear remedy resonates powerfully across mindsets, not that copyright is the only issue worth raising.
Workers: a broad coalition on substance, but a framing collapse at the more engaged end of the audience. The Workers message does something no other frame achieves: in dial testing, the patriotic opening surges 12 points in the first ten seconds, the fastest initial rise of any message following a values-villain-vision structure. Then, as the message pivots to its villain, “global corporations want to replace British workers with AI, pocket the profits, and send them overseas,” the Uncertain Middle and Disengaged Traditionalists break sharply away, crossing the 50 neutral threshold into active disapproval. At their lowest point, Disengaged Traditionalists fall to 48.9 and the Uncertain Middle to 47.5. This is the villain section working as intended: people are registering opposition to the prospect being described, not to the message itself. From that trough, all mindsets build steadily through the remedy, workers and unions at the table, automation strengthening schools, the NHS, and communities, landing in a similar place with a total sample mean of 68.8.
On considered reflection, Workers delivers the most consistent lift across all mindsets. Its topline (72.2) sits slightly below those of Copyright and Independent Regulator, but it produces solid increases across every mindset, including the largest jump among the Uncertain Middle and the highest score among Disengaged Traditionalists (73.3). The qualitative evidence refines this reading. The >70 in every mindset reflects genuine agreement on the substance: people are anxious about the impact AI will have on work, and want to see stronger worker protections against corporate displacement. Yet the focus groups expose a framing problem in the tested message, with the nostalgic-British-worker opening splitting the Labour coalition rather than uniting it.
In the first session, the room mostly gave the message a 4 out of 5. The substance landed. Yasmin, a single mother in the Midlands, engaged immediately: “Why is the money going abroad?… So it’s not benefiting us at all.” Philippa, a former lecturer and the room’s dissenter, called the opening “designed to appeal to the flag shaggers.”
In two later sessions, both held with professional, ethnically-inclusive, service-economy-literate participants, Philippa’s objection became the majority view, with five of nine independently rejecting the opening on the same grounds. Farah, a council digital-inclusion officer in Birmingham, put it: “it’s not a message that’s been written for us. It’s written about us. That’s the bit that doesn’t work.” In the next session, it went further: three participants scored the message at 1 on a four-point scale, no 3s. Chris, a political historian, drew the consequence: “this is a framing that Reform would use, and use better. If you’re going to cede the nationalist framing territory to them, they’ll win it.”
The three rooms tell a consistent story: the substance engages everyone, the framing splits the Labour coalition. The quant shows the asymmetry: 79.4 with Alarmed Populists, 69.6 with Hopeful Regulators. Reform-risk voters warm to the opening; Green-risk voters push back. Both are Labour-defection pools, and the message has to hold both.
Flora, an employment lawyer in London, offered the fix: “I’d strip the opening and put in, you know, workers in call centres, workers in hospitals, workers in warehouses, workers in classrooms. Keep the substance. Lose the flag.” Her list describes the workforce Britain actually has, and it lands for both the Reform-leaning worker and the Green-leaning professional. The implication is to update the industrial-worker image, not retreat from worker protections. The villain and the remedy hold. The audience widens.
Long-term: the argument people do not engage with. Where the other three policy messages all produce a clear arc in response, the Long-term message never generates that kind of engagement. The total sample starts at 53.9 at the ten-second mark, the lowest opening, and finishes the scripted portion at just 66.1, also the lowest. Within that muted response, three distinct patterns emerge. Market Optimists and Hopeful Regulators, the mindsets with the deepest existing understanding of AI’s trajectory, express more concern throughout, with Hopeful Regulators achieving the highest final dialled score at 67.9. Pragmatic Sceptics track close to the mindset median. But Alarmed Populists, Disengaged Traditionalists, and the Uncertain Middle register significantly less concern, suggesting that arguments about long-term AI risk engage those who already follow the technology closely but largely fail to reach those who do not. This is also the only message in which the total sample dips below 50 during the reflection period, reaching 49.7: the aggregate population briefly trends towards net disagreement even after the message ends.
The post-exposure scores show a recovery. Alarmed Populists jump to 77, and most mindsets register large gains on considered reflection. The framing benefits from thought: people who sit with it become more persuaded. But a message that persuades on reflection while failing to move people in the moment is a meaningful limitation for political communications.
Across each room, the orientation was towards everyday AI harms that are already visible, not hypothetical future ones. When the existential or loss-of-control framing is put forward, it is actively refused. Kirstie, in the third session, called it “scaremongering… reminds me a little bit of when we got into the year 2000.” Freya argued the frame away: “you can just turn it off… pull the plug out and it’s gone.” Dionne added, “It’s just silly that we’d become prisoners to AI.” Three voices, one room, same instinct: the existential frame misreads the timing of the concern.
The sharpest diagnosis comes from inside the field itself. Millie, a postdoc researcher at a university, described the problem directly: “I think the framing that’s dominant in AI safety is overly focused on hypothetical catastrophic risks, and under-focused on the harms that are actually happening now. So my concern sits between the existential-risk people and the near-term-harms people, and I think both groups have bits they’re missing.” She was describing her own professional community. If the field’s dominant framing is already too remote for its insiders, a message built on it will struggle to land on a dial test.
Where participants did engage with longer horizons, they did it through concrete anchors. Rory, an NHS clinician, split the question by application: “If you asked me about AI in oncology imaging, I’m cautiously optimistic. If you asked me about AI on TikTok, I’m horrified.” Karim, an NHS scientist, made the same move: “I am excited about specific applications. I am concerned about the sector as a whole.” Alice, in the same room, reached for the climate horizon in plain terms: the loss, she said, falls on “future generations, honestly, and… communities who happen to sit near a data centre.”
The implication for communicators is that the Long-term argument sits wrong with this audience, not because they do not think about the future, but because they will not trade a concrete near-term concern for an abstract distant one. A message that wants longer horizons has to arrive through specific present-day anchors: a data centre someone’s town will host, a clinical tool their GP might use, a job someone’s daughter is trying to get. Without that anchoring, the dial finds its floor.
Innovation and Growth: the broadest real-time support, the sharpest erosion on reflection. Innovation and Growth achieves the highest initial response of any message. At the ten-second mark, the total sample sits at 62.5, above Independent Regulator (61.4), Copyright (61.8), and Workers (61.9), and well above Long-term (53.9). The opening lands immediately and broadly. As the only message that does not follow a values-villain-vision structure, asserting hope without trade-offs, it sustains broad support throughout the dial and finishes with the tightest mindset spread: just 2.1 points between the highest and lowest mindsets (total sample 68.7). By this measure, Innovation and Growth builds the broadest real-time coalition of any frame tested.
But this breadth collapses on reflection. Innovation and Growth is the only message where multiple mindsets decline from their instant to their considered score: Alarmed Populists drop from 64 to 61, the Uncertain Middle from 64 to 60. Meanwhile, Market Optimists surge from 65 to 75, opening up the widest gap between any two mindsets on any message. The message that was the most unifying in real time becomes the most polarising on reflection. It is the only message Conservative voters rated higher than Labour voters (71.5 vs 69.1), the only one Green voters actively disliked (59.3), and it produces the widest gender gap of any message tested (women 65.0 vs men 69.3). Among Alarmed Populists it scores just 60.7, the lowest considered score any message receives from any mindset. The “responsible innovation” case is broadly popular in the moment, but once people have time to think, the absence of a named actor, a concrete harm, and a clear remedy leaves most mindsets less persuaded than they were while listening.
The Uncertain Middle remains hard to reach. Every message scores between 59.6 and 66.0 with this mindset on the post-exposure assessment (11% of the population), with Copyright achieving the best result (66.0). No frame tested penetrates their indifference, and they may require a different mode of engagement entirely, perhaps experiential rather than argumentative. But the Workers dial data offers a clue: this is the only message that provoked an active negative response from the Uncertain Middle (dipping to 47.5), which may paradoxically be its strength. A message that first makes people feel something, even concern, and then resolves it may be more effective than one that never registers at all.
What these results suggest together. The single strongest predictor of both real-time engagement and post-exposure durability is whether a message names specific actors, identifies concrete harms, and offers a clear remedy. Hope without accountability does not survive scrutiny. We see this most clearly in the strength of the most tangible messages, copyright and workers, which is reinforced by the tangible accountability in the Independent Regulator message. Although long-term deepens concern amongst already engaged and sympathetic audiences, it does not appear to move key parts of the public. The Innovation and Growth message, despite its real-time appeal, does not survive a primed review and sharply polarises on reflection.
8.1.1 Comparisons to Other Research
The Tony Blair Institute’s 2025 report[17] recommends that communicators frame AI around tangible use cases addressing voter priorities such as appointment scheduling, service access, and traffic reduction on the basis that experience drives more positive perceptions. Their data supports this: weekly AI users are roughly 20 percentage points more likely to see AI as an opportunity than non-users, a pattern our data confirms (Section 1.1).
However, our dial testing suggests that although using tangible and familiar examples is extremely important, when the objective is persuasion rather than familiarisation, use-case framing alone underperforms. The message closest to a benefits frame in our battery, the Innovation and Growth message, which led with AI’s real-world benefits and proposed clear, risk-based rules, scored lowest overall (67.1) and was the only message to divide along partisan lines. It was also the weakest performer with Alarmed Populists (60.7) and Pragmatic Sceptics (65.7), the two most electorally volatile mindsets.
The messages that scored highest, Copyright (75.4) and Independent Regulator (72.7), did not lead with benefits. They led with identifiable actors, concrete harms, and clear remedies that then realised these benefits.
Benefits-framing may work for adoption campaigns or public service communications. But for political messaging aimed at building a political coalition for AI governance, naming who is responsible and who is harmed outperforms only describing what AI can do.
8.1.2 Recommendations for Future Messaging
These findings are consistent with narrative principles that have tested well across multiple Diffusion research projects. We recommend six principles for AI policy communications going forward.
- Start with a positive vision for the future. The most persuasive messages are not catalogues of harms. People already have enough problems and are not looking for more, particularly when opponents are presenting an attractive vision of technological progress. To win people over, lead with a clear picture of how the world, and their own lives, will be better. Say what we want, not just what we oppose.
- Anchor that vision in shared values. The Copyright message works in part because it activates a widely held sense of fairness: people who create things deserve to be paid for them. Leading with values connects the argument to something deeper than policy detail. These are not partisan signals. They are principles like fairness, opportunity, and respect for human dignity that resonate across divides and work well against narrow economic rationalism.
- Make the benefits tangible and personal. Abstract appeals to a “free and open society” or a “global accountability framework” do not move people. The messages that scored highest connected to everyday life: the livelihoods of working artists, the safety of national infrastructure, the protection of working people’s jobs. Benefits related to health outcomes, personal economic security, or independence are what consistently motivate.
- Name the actors, their actions, and the consequences. The Copyright message names US billionaire-led tech firms. The Independent Regulator message names the regulator and gives it specific powers. The Innovation and Growth message names no one, and performs worst. Without clear actors, responsibility dissolves and the public cannot see how different choices would produce different results. This means never suggesting that “AI” is the actor. It is the people building and deploying these systems who are making choices and should be held accountable. Where possible, emphasise independence and local control.
- Choose a narrative frame and use it consistently. The strongest-performing messages each employ a coherent frame: creators being exploited, infrastructure that needs safeguarding, workers being replaced. The weakest messages mix metaphors or stay at such a level of generality that no frame activates at all. We recommend the BUILDING frame. We need to develop a blueprint, build strong foundations, lock in opportunity and lock out risk, while building something that will benefit future generations. This frame positions the public and policymakers as constructive agents with agency over what gets made, and it compounds over time when used consistently across messages. Avoid the JOURNEY/RACE, JOURNEY, or WAR frames, which imply urgency, competition, and threat in ways that play to opponents’ strengths.
- Underscore urgency without catastrophising. AI is a transformative technology and the pace of change is accelerating. Communicators should frame urgency as a shared mission, such as “we need to make the right decisions now to shape a better future,” rather than as a catalogue of risks. This aligns the speaker and the public in a common project and draws on the BUILDING frame: foundations laid now determine what gets built. Urgency without agency produces anxiety; urgency with a plan produces action.
8.2 A/B Testing: Messaging Impact on Policy Priorities
To further test how attitudes shift under different framing conditions, we conducted a series of paired comparisons. Each respondent answered the same question twice: once at baseline, and once after being exposed to AI company favourability information. The results show that across almost every mindset, pro-regulation sentiment intensifies on the second ask.
Trust in AI Decisions
Appetite for Government Intervention
Six policy trade-offs were tested, each pitting a pro-innovation framing against a pro-regulation alternative. On every question, the public leans pro-regulation, and that lean deepens on the second ask.
AI Company Favourability: Impact on Oversight Attitudes
Does showing people AI company favourability data change their views on human oversight? The answer varies dramatically by mindset.
AI Regulation: Sovereignty Framings Compared
Three versions of the same regulation question were tested across mindsets: a neutral framing, a US dependency framing, and a China competition framing.
Wealth vs Takeover Framing
Two regulation arguments were each tested against a pro-innovation counter-argument. Both regulation framings dominate, but the “takeover” framing slightly outperforms “wealth” among the most populist mindsets.
9. Recommendations

Core Message Architecture
Every recommendation below flows from a single message structure: values, villain, vision.
- Values: We want a future where technology works for ordinary people, where creators are paid, workers are protected, kids are safe, and communities decide what happens in their own backyards
- Villain: A handful of US tech billionaires are making choices that benefit themselves at everyone else’s expense, and right now, nobody is stopping them
- Vision: Strong, independent rules that put us in charge of how these technologies are used, with real teeth and real consequences for companies that break them
For Politicians and Party Strategists
The public needs you to back legislation that gives an independent regulator real enforcement powers over AI companies, and to say so publicly.
For Policy Communicators and Campaigners
The public needs you to speak like them, anchor your tech advocacy around the fundamental billionaire power imbalance frame, and begin reaching those in marginal seat areas with relatable messengers through the traditional and new media they read.
For Funders and Philanthropists
The public needs you to fund TV and radio campaigns in regions and with non-expert audiences, not just digital advocacy in London.
For Regulators and Civil Servants
The public needs you to demonstrate visible enforcement, including investigations, audits, and real penalties, so the public can see someone is in charge.
10. Methodology
This section is organised in three parts. 10.1 Data Collection describes the primary research instruments. 10.2 Analysis describes the techniques applied to those data, with a measurement note on vote recall. 10.3 Inferential Overlays describes the estimated profiles layered onto the segmentation to support strategic interpretation, which should be read as group-level tendencies rather than direct measurement.
10.1 Data Collection
10.1.1 Survey and Sample
This study was conducted by Diffusion.Au and CPS Insights, with data collected by YouGov, using an online panel of UK adults. The questionnaire comprised 773 variables covering AI attitudes, policy preferences, demographic characteristics, media consumption, and political behaviour. A built-in experimental component randomly assigned respondents to one of three framing conditions (neutral, US frame, or China frame) before re-measuring policy attitudes.
The sample included 2,911 adults aged 18+, balanced by age, gender, ethnicity, education, and region (nine English divisions plus Scotland, Wales, and Northern Ireland), with oversamples of 250 Black adults, 250 Asian adults, and 400 voters in marginal constituencies decided by fewer than 3 percentage points at the 2024 General Election. The survey was fielded between 27 November 2025 and 19 December 2025. The margin of error for the full sample (p=0.5, 95% CI) is ±2.7%, with larger margins for subgroups.
Post-stratification raked weighting was applied by gender, age, region, ethnicity, and education to ensure representativeness of the adult UK population. Respondents who selected “Prefer not to say” on ethnicity or education were weighted to zero, reducing the effective weighted base from 2,911 to 2,774. As with all sample surveys, results are subject to sampling error. For example, a 50% response from a question answered by the full sample would, with 95% confidence, fall between 47.3% and 52.7% in repeated samples of the same size drawn from the population.
10.1.2 Dial Testing
The survey incorporated a real-time dial test in which every respondent rated each message on a 0–100 slider that opened at 50 and had to be moved at least once every two seconds, generating a continuous approval trace. Messages were shown in random order; traces were smoothed and weighted in line with the main survey; and mean scores, as well as lifts by the six audience mindsets, were calculated using the same 95% confidence standards used throughout the study. This method was chosen over other message testing methodologies as the dial captures the immediate emotional pulse (where approval rises, stalls, or plunges), revealing which words persuade, which phrases trigger concern, and ultimately which messages are most likely to shift support for sensible AI safeguards with statistical confidence.
10.1.3 Focus Groups
Between 13 and 17 April 2026, Diffusion conducted five online focus groups to deepen the quantitative findings set out in this report. Participants were recruited by Roots Research against a custom screener developed by Diffusion and CPS Insights, which used the LCA questions most determinative of mindset membership to ensure genuine matches to each profile. Each group ran over Zoom for two hours with between 8 and 12 participants and a £50 incentive, moderated by the lead author. Recruits were drawn from across the UK, with all nations and regions represented and deliberate weighting towards the Midlands and North. The five groups corresponded to Alarmed Populists, the Uncertain Middle, Hopeful Regulators, Pragmatic Sceptics, and women considering moving away from Labour in constituencies Labour holds with a majority under 3%.
Each group used a discussion guide tailored to the themes most relevant to it, with a consistent third section held constant across all five: attitudes towards AI, views on the state of the country, and reactions to the copyright message (the top-scoring message in our quantitative dial testing, used here as the focus group control). This section serves as the comparability anchor for cross-mindset contrasts.
Sessions were recorded and transcribed via Zoom’s automatic transcription and analysed thematically by the lead author, with a parallel AI-assisted pass using Claude Opus 4.7 as a cross-check on the coding. Findings rest on the manual analysis; the AI pass was used to identify themes the author may have missed, not to generate conclusions. Quotes have been lightly edited to remove filler and awkward pauses; substantive content is unchanged. All participants signed informed consent, names have been changed, and attribution follows the format Pseudonym, gender, age, mindset, region. Qualitative findings are illustrative rather than statistically representative and should be read alongside the quantitative evidence.
10.2 Analysis
10.2.1 Latent Class Segmentation
Latent Class Analysis is a statistical method that looks for groups of people who answer questions in similar patterns. Rather than dividing people by age or region, it finds clusters where attitudes, values, and concerns naturally move together, revealing mindsets that demographic categories alone would miss. The resulting mindsets closely mirrored those found in the California AI Compass study, allowing for cross-national comparison. The same mindset structure was retained, with one modification: the original ‘Disengaged’ mindset was split into two mindsets, Disengaged Traditionalists and Uncertain Middle, to better capture variation in engagement and uncertainty levels. The six-mindset solution produced the most consistent and interpretable profiles. Model selection was based on BIC and interpretability. Mindset sizes range from 11.1% (Uncertain Middle) to 24.1% (Disengaged Traditionalists).
10.2.2 CART Analysis
CART analysis works like a decision tree. It asks: what single characteristic best predicts whether someone is excited about AI? It then splits the sample on that characteristic and repeats the process, building a tree of the most important factors.
10.2.3 AI Literacy Index
Replicating the methodology in the California AI Compass, itself modelled on Long and Magerko’s (2020)[24] multi-domain competency framework for AI literacy and the self-reported familiarity scales used by Gillespie et al. (2023)[25], each respondent’s AI Literacy Score was calculated as the average of their z-standardised responses to nine five-point Likert items measuring familiarity with AI’s outcomes, risks, core concepts, and enabling technologies. These values were then linearly rescaled to a 0–100 scale, where higher scores reflect greater conceptual understanding. For interpretability, respondents were grouped into five ordered literacy bands (Lowest, Lower, Mid, Higher, and Highest) derived from the distribution observed in the UK sample.
10.2.4 Narrative Frame Coding
To map the narrative logic embedded in public discourse, we applied the Narrative Frames typology, originally developed by the lead author at the University of Cambridge, to a corpus of 2,758 open-text responses to “Can you explain AI to a friend?”. Each response was processed through a two-stage qualitative coding pipeline. Metaphor Identification: responses were first screened using the Pragglejaz Group’s Metaphor Identification Procedure (MIP)[26] to detect metaphorical expressions. A second pass applied Charteris-Black’s Critical Metaphor Analysis (CMA) framework[27] to identify figurative constructions contributing to narrative coherence and persuasive force. Frame Assignment: identified metaphorical fragments were coded to one of 22 primary narrative frames (and, where applicable, one of 28 sub-frames). Each respondent’s answer was thereby assigned a full “frame profile,” indicating which narratives were invoked, and which were absent. This allowed us to quantify frame prevalence, blending, and clustering across the sample, and to compare public responses to previously analysed elite discourse, showing where the public and policymakers diverge in how they conceptualise AI.
10.2.5 Hierarchical Value Mapping
To surface the value-architecture beneath the focus group corpus described in 10.1.3, we applied Hierarchical Value Mapping (HVM) using the formal laddering technique developed by Reynolds and Gutman (1988)[39]. HVM is an established market-research method for tracing how individuals connect concrete attributes (things they discuss) up through functional consequences (what those things do), emotional consequences (how the situation feels), and terminal values (what is ultimately at stake). Mapped at corpus level, the resulting graph shows the routes through which concrete experience climbs to deeply held value, and which of those routes are load-bearing across a population.
All five focus group transcripts were coded line-by-line to extract every attribute-to-value chain present in the speech. The pilot was conducted on Group 1 by the lead author, with the resulting codebook used as the master code list for the remaining four groups. As with the thematic analysis described in 10.1.3, coding was performed by the lead author with a parallel AI-assisted pass using Claude Opus 4.7 Max as a cross-check on the coding; per-group additions were manually reviewed and reconciled into a single master codebook. The complete corpus produced 282 ladders across the 48 participants (mean 5.9 per participant), drawn from 164 master codes (45 attributes, 62 functional consequences, 30 emotional consequences, 27 terminal values). Functional consequences were further consolidated into 10 thematic buckets at the display layer to manage visual density without altering the underlying codebook.
Each participant was independently classified along the dialectical axis used in Section 6.6: Activated (believes institutional action on AI is possible and worth demanding), Resigned (believes such action will not come, that it is too late or the system is captured), or Mixed (carries both registers across the session). Classification was performed by the lead author from the analytical memos and then verified line-by-line against the raw transcripts. The final distribution was 13 Activated (27%), 26 Mixed (54%), and 9 Resigned (19%); Mixed as the plurality is a substantive finding in its own right.
Edges between codes were aggregated into per-classification implication matrices and a master matrix covering the full corpus. Following the Reynolds and Gutman cutoff convention, the master Hierarchical Value Map renders only those edges with a count of three or more total references and at least two distinct contributing participants, removing idiosyncratic chains while preserving structurally consequential ones. Edge colour on the master map encodes which classification dominates each edge. Per-classification cutoffs were relaxed asymmetrically to account for the unequal corpus sizes (13/26/9 participants), an explicit methodological adjustment documented in the underlying analytical files.
As with all qualitative coding by a solo coder, the classifications and ladders are interpretive. They are anchored in specific things participants said and verified against the raw transcripts, but they should be read as a structured analytical reading of the corpus rather than as direct measurement. The HVM is presented as a characterisation tool that surfaces the architecture of belief beneath the survey-derived findings, not as a substitute for them.
10.2.6 Vote Recall (Measurement Note)
Respondents were asked how they voted in the 2024 general election. As is standard in post-election surveys, recalled vote shares differ from official results, particularly for the Conservatives (14.7% recalled vs 23.7% actual) and the Liberal Democrats (7.8% vs 12.2%). This reflects vote recall bias, a well-documented phenomenon in which respondents’ reported past vote drifts over time towards their current preference or the winning party.[28],[29] The effect is independent of sample quality and increases with the interval between the election and the survey. Our fieldwork took place 17 months after polling day. The survey is weighted by standard demographics, not by recalled vote, so readers should note that the 2024 vote column in voter-flow analyses reflects what respondents report having done, not a corrected reconstruction of the actual result.
10.3 Inferential Overlays
10.3.1 Estimated Value Profiles
The survey captured a range of value-adjacent indicators, including distributional fairness beliefs, policy trade-off preferences, institutional trust, and narrative framing, but did not deploy a dedicated values battery such as Schwartz’s Portrait Values Questionnaire. To map these dispersed signals onto a structured values framework, we constructed estimated profiles using a two-stage approach.
Stage 1: Demographic baseline. We drew on the European Social Survey (ESS), which has administered Schwartz’s 21-item PVQ-21 to nationally representative UK samples across eleven rounds (2002–2024). The PVQ-21 measures ten basic human values: Self-Direction, Stimulation, Hedonism, Achievement, Power, Security, Conformity, Tradition, Benevolence, and Universalism. Published demographic-value correlations from multi-country ESS analyses (notably Davidov et al., 2022, N=374,729 across 32 European countries) were used to estimate baseline value scores for each mindset’s demographic profile, defined by age, gender, education, social grade, and political orientation.
Stage 2: Attitudinal enrichment. These baselines were adjusted using attitudinal signals measured in the AI Compass survey. For example, high scores on the economic populism measure were treated as evidence of elevated Universalism-Concern; dominant use of the MACHINE narrative frame as evidence of elevated Self-Direction and Achievement; and voting defection towards the Green Party as evidence of elevated Universalism-Nature. Adjustments were applied directionally, not as precise quantitative corrections.
The resulting profiles present the top eight estimated value priorities per mindset on a relative index (0–100), with labels translated into colloquial equivalents (e.g., “Security” becomes “Keeping my family safe”). These are informed estimates of group-level tendencies. Individual-level variance within each mindset will be substantial; demographic predictors typically explain 5–15% of individual variation in values scores. The profiles are intended to support strategic communication planning, not substitute for direct values measurement in future waves.[21],[22]
10.3.2 Estimated Emotional Profiles
The survey measured concern intensity, perceived likelihood of 19 AI-related risks, narrative frame usage, AI literacy, government trust, and policy preferences. These capture the substantive content of respondents’ concerns but not their affective experience directly. Following the approach developed by Smith and Leiserowitz (2014) for Yale University’s Six Americas climate change segmentation, in which emotional profiles were mapped onto attitudinal audience segments, we constructed composite profiles by linking survey indicators to candidate emotions with a clear theoretical rationale.[23]
- Frustrated: the gap between regulation demand and government trust. A mindset that overwhelmingly demands regulation but has near-zero confidence in government delivery registers high frustration.
- Protective: concern about children’s safety, opposition to NHS data sharing, and the importance placed on human oversight.
- Curious: AI usage rates, AI literacy scores, and the proportion expressing excitement despite concern.
- Overwhelmed: the proportion perceiving AI’s pace as “too fast,” combined with low AI literacy.
Each emotion’s composite score was normalised to a 0–100 index, weighted to reflect the strength of the theoretical mapping, and the top eight to ten were ranked per mindset. These profiles are inferential: they represent a structured interpretation of what the attitudinal data implies about how each mindset experiences AI as a public issue. They are broadly consistent with qualitative findings from the accompanying focus groups and are presented as a characterisation tool, not a psychometric measure.
10.3.3 Estimated Media and Personality Preferences
The survey captured each respondent’s favourability towards eighteen named public figures and institutions, but did not directly measure newspaper readership, broadcaster consumption, or trust in professional categories. To enrich each mindset with these dimensions, we constructed estimated overlays using a two-path approach.
Path 1: Direct measurement. For public figures and institutions, segment membership and favourability are observed in the same respondent. Per-mindset rates and over-indexes against the UK average are computed directly from this survey, with no bridging or inference required.
Path 2: Bridged measurement. For newspapers, broadcasters, online news brands, and trusted professions, demographic cross-tabs were drawn from public sources. These included the Ofcom News Consumption Survey (Open Government Licence v3.0, fielded November 2024 to April 2025) for media consumption, and the Ipsos UK Veracity Index 2025 for professional trust. Each mindset’s signature (current vote intent × age × gender × location × social grade) was projected onto these cross-tabs through a naive direct-standardisation bridge with inverse-variance pooling across dimensions, yielding estimated per-mindset rates.
The resulting overlays are inferential. Validated in-sample against ten institutional anchors measured directly in the survey, the bridge has a mean absolute error of approximately 10 percentage points and a predicted-versus-truth correlation of 0.72; most over-indexes therefore point in the right direction, but magnitudes should be read as first-order signals rather than precise figures. Each over-index reports a 95% confidence interval from a 200-iteration bootstrap, capturing full uncertainty for the direct-measurement path and sampling variance only for the bridged path. As with the values and emotional profiles, these are presented as characterisation tools to support strategic communications, not as substitutes for direct measurement of media use or professional trust in future waves.
Footnotes
- Ada Lovelace Institute and The Alan Turing Institute (2025) Attitudes to AI: Longitudinal Tracker. https://attitudestoai.uk/ ↑
- Ada Lovelace Institute (2025) Great Expectations: Public Attitudes to AI Governance. https://www.adalovelaceinstitute.org/policy-briefing/great-expectations/ ↑
- University of Oxford (2025) ‘New Oxford research reveals Uber’s algorithmic pricing leaves drivers and passengers worse off’. https://www.ox.ac.uk/news/2025-06-23 ↑
- Competition and Markets Authority (2025) Ticketmaster: Consumer Protection Case. https://www.gov.uk/cma-cases/ticketmaster-consumer-protection-case ↑
- Górecka, A. (2026) ‘Airline booking engines in the UK: competition, privacy and consumer protection’, Wolters Kluwer Competition Law Blog. https://legalblogs.wolterskluwer.com/competition-blog/airline-booking-engines ↑
- Sawers, I. and Scanlon, L. (2025) ‘The regulation of AI in UK insurance: an introductory guide’, Pinsent Masons Out-Law. https://www.pinsentmasons.com/out-law/guides/the-regulation-of-ai-in-uk-insurance ↑
- Collins, G. (2025) ‘Electronic shelf labels raising retail prices’, Food Digital. https://fooddigital.com/news/electronic-shelf-labels-raising-retail-prices ↑
- Downes, H. (2024) ‘Dynamic pricing: how does it work and is it legal?’, Which?. https://www.which.co.uk/news/article/dynamic-pricing ↑
- Department of Health and Social Care (2025) ‘AI to be trialled at unprecedented scale across NHS screening’. https://www.gov.uk/government/news/ai-to-be-trialled ↑
- House of Lords Library (2024) ‘AI in the NHS’. https://lordslibrary.parliament.uk/ai-in-the-nhs/ ↑
- HM Government (2024) The King’s Speech 2024. https://www.gov.uk/government/speeches/the-kings-speech-2024 ↑
- House of Commons Library (2026) ‘AI regulation in the UK’. Research Briefing CBP-10003. https://commonslibrary.parliament.uk/research-briefings/cbp-10003/ ↑
- Osborne Clarke (2026) ‘Regulatory outlook: artificial intelligence’. https://www.osborneclarke.com/insights/regulatory-outlook-january-2026 ↑
- Department for Science, Innovation and Technology (2025) AI Opportunities Action Plan. https://www.gov.uk/government/publications/ai-opportunities-action-plan ↑
- Harvey Nash (2025) ‘Peter Kyle outlines the UK’s AI ambitions’. https://www.harveynash.co.uk/latest-news/peter-kyle-outlines-the-uks-ai-ambitions ↑
- TIME (2025) ‘Peter Kyle’, TIME100 AI 2025. https://time.com/collections/time100-ai-2025/7305877/peter-kyle/ ↑
- Tony Blair Institute and Ipsos (2025) ‘What the UK thinks about AI: building public trust to accelerate adoption’. https://institute.global/insights/tech-and-digitalisation/what-the-uk-thinks-about-ai ↑
- Nannestad, P. and Paldam, M. (2002) ‘The cost of ruling: a foundation stone for two theories’, in Dorussen, H. and Taylor, M. (eds.) Economic Voting. London: Routledge, pp. 17–44. https://papers.ssrn.com/sol3/papers.cfm?abstract_id=165709 ↑
- Green, J. and Jennings, W. (2017) The Politics of Competence: Parties, Public Opinion and Voters. Cambridge: Cambridge University Press. https://www.cambridge.org/core/books/politics-of-competence ↑
- Stone, D. (2024) ‘Narrative frames: a new approach to analysing metaphors in AI ethics and policy discourse’. arXiv preprint. https://arxiv.org/abs/2603.17192 ↑
- Schwartz, S. H. (2012) ‘An overview of the Schwartz theory of basic values’, Online Readings in Psychology and Culture, 2(1). doi: 10.9707/2307-0919.1116 ↑
- Davidov, E. et al. (2022) ‘Do demographic predictors of personal values vary by context?’, Social Science Research. doi: 10.1016/j.ssresearch.2022.102817 ↑
- Smith, N. and Leiserowitz, A. (2014) ‘The role of emotion in global warming policy support and opposition’, Risk Analysis, 34(5), pp. 937–948. doi: 10.1111/risa.12140 ↑
- Long, D. and Magerko, B. (2020) ‘What is AI literacy? Competencies and design considerations’, Proceedings of the 2020 CHI Conference on Human Factors in Computing Systems, pp. 1–16. doi: 10.1145/3313831.3376727 ↑
- Gillespie, N., Lockey, S., Curtis, C. and Darragh, M. (2023) Trust in Artificial Intelligence: A Global Study. The University of Queensland and KPMG Australia. https://doi.org/10.14264/00d3c94 ↑
- Pragglejaz Group (2007) ‘MIP: a method for identifying metaphorically used words in discourse’, Metaphor and Symbol, 22(1), pp. 1–39. doi: 10.1080/10926480709336752 ↑
- Charteris-Black, J. (2004) Corpus Approaches to Critical Metaphor Analysis. Basingstoke: Palgrave Macmillan. ↑
- Wells, A. (2019) ‘False recall, and how it affects polling’, YouGov. https://yougov.co.uk/politics/articles/24349-false-recall-and-how-it-affects-polling ↑
- Mellon, J. and Prosser, C. (2017) ‘Missing nonvoters and misweighted samples: explaining the 2015 Great British polling miss’, Public Opinion Quarterly, 81(3), pp. 661–687. doi: 10.1093/poq/nfx015 ↑
- Norris, P. (ed.) (1999) Critical Citizens: Global Support for Democratic Governance. Oxford: Oxford University Press. See also Norris, P. (2011) Democratic Deficit: Critical Citizens Revisited. Cambridge: Cambridge University Press. ↑
- Mudde, C. (2004) ‘The populist Zeitgeist’, Government and Opposition, 39(4), pp. 541–563. doi: 10.1111/j.1477-7053.2004.00135.x ↑
- O’Neill, O. (2002) A Question of Trust: The BBC Reith Lectures 2002. Cambridge: Cambridge University Press. See also O’Neill, O. (2018) ‘Linking trust to trustworthiness’, International Journal of Philosophical Studies, 26(2), pp. 293–300. doi: 10.1080/09672559.2018.1454637 ↑
- OECD (2024) OECD Survey on Drivers of Trust in Public Institutions – 2024 Results: Building Trust in a Complex Policy Environment. Paris: OECD Publishing. ↑
- Bauhr, M. and Grimes, M. (2014) ‘Indignation or resignation: the implications of transparency for societal accountability’, Governance, 27(2), pp. 291–320. doi: 10.1111/gove.12033 ↑
- Tyler, T. R. (2006 [1990]) Why People Obey the Law. Princeton: Princeton University Press. See also Tyler, T. R. (2003) ‘Procedural justice, legitimacy, and the effective rule of law’, Crime and Justice, 30, pp. 283–357. doi: 10.1086/652233 ↑
- Kosiara-Pedersen, K. (2020) ‘Stronger core, weaker fringes: the Danish general election 2019’, West European Politics, 43(4), pp. 1011–1022. doi: 10.1080/01402382.2019.1655920. See also Mudde, C. (2019) The Far Right Today. Cambridge: Polity. ↑
- Cornwall, A. (2008) ‘Unpacking “participation”: models, meanings and practices’, Community Development Journal, 43(3), pp. 269–283. doi: 10.1093/cdj/bsn010. See also Boulianne, S. (2019) ‘Building faith in democracy: deliberative events, political trust and efficacy’, Political Studies, 67(1), pp. 4–30. doi: 10.1177/0032321718761466. ↑
- Mellier, C. and Wilson, R. (2020) Getting Climate Citizens’ Assemblies Right. Carnegie Europe. See also Giraudet, L.-G. et al. (2022) ‘“Co-construction” in deliberative democracy: lessons from the French Citizens’ Convention for Climate’, Humanities and Social Sciences Communications, 9, article 207. doi: 10.1057/s41599-022-01212-6 ↑
- Reynolds, T. J. and Gutman, J. (1988) ‘Laddering theory, method, analysis, and interpretation’, Journal of Advertising Research, 28(1), pp. 11–31. ↑