2026 Californian AI Compass
A year of AI changed California’s habits, but not its conviction that AI must have strong guardrails

Executive summary 
Californians have settled the question of whether AI needs strong guardrails, and their answer is resoundingly “yes.” Heading into the critical last weeks of the 2026 legislative session, we surveyed 3,164 California adults to understand how they feel about AI and what they want their legislators to do about it, deliberately re-asking many of the questions we had put to the state in May 2025 so we could see what a year of mass adoption changed, and what it did not.
We found that more Californians than ever are using these tools, with 79% saying they have now used an AI tool, 58% using one at least weekly, and trust in AI to make important decisions about you rising from 15% to 23%. (Section 1)
Yet more and more people have lost faith in the AI project, and in the companies and people building it. Californians are now twice as likely to feel concerned about where AI is heading as excited, by 58% to 29%, and that gap widened over the year: net excitement fell 8 points from −21 to −29, while net favorability toward AI fell 8 points from +14 to +6 even while use rose. Of all the people and institutions we tested, “AI company executives” came out worst, at −24 net favorability, the lowest score in California politics, below even Elon Musk (himself at −18). 60% of Californians believe AI’s benefits will flow to the wealthiest households and corporations, against 22% who believe working people will benefit. Meanwhile, only 31% think it will create new jobs. In fact, more people believe AI will take control of nuclear weapons (35%) than create new jobs. While faith in AI and the people making it has fallen, the demand for strong laws has not. When choosing between letting companies innovate responsibly and mandating strong laws, 70% of people choose the stronger laws, a figure that is effectively unchanged since May 2025. (Section 2)
But only 5% of Californians call the power of big tech companies a top-three issue; instead, they see AI impacting the things they do care deeply about. Inflation (a top-three issue for 68%), housing (43%), and jobs (35%) own the state’s attention, and Californians increasingly see AI as a force behind those worries: 58% are concerned AI will make essentials like housing and electricity more expensive, and nearly half think it’s likely or very likely that it will. This broad concern is also matched by a more personal frustration with how AI systems are already being used by some organizations, such as the 43% of Californians who have personally been trapped by an automated system that would not let them reach a human. (Section 3)
Yet each of these concerns has a clear policy response, and Californians overwhelmingly support the policy ideas we tested. Six of the seven proposals were designed to protect the public, covering automated firings, workplace surveillance, AI-driven job cuts, surveillance pricing, and other concerns. All six won by net margins of +42 to +67. Meanwhile, when we presented the competing case in its own terms, as giving companies more room to innovate, Californians rejected it by almost three to one. The strongest result came from requiring a person, rather than an AI system alone, to make the final decision when a worker is disciplined or fired. It won support by 75% to 8%, including net margins of +70 among Republicans and +82 among seniors. Nor did support fall away when people heard the other side: for five proposals, respondents first saw an argument supporting each position, and all five safeguards still won by clear margins. Beyond the policies themselves, we also find that tech money may now cost candidates votes. When told that a candidate was funded by “tech billionaires like Sam Altman and Peter Thiel”, 22% said they would be much less likely to support that candidate. (Section 4)
Beneath the statewide verdict, California is no longer as undecided about AI as it was. The California AI Compass sorts the state not by party or age but by how people think and feel about AI. All five mindsets we identified in 2025 returned in 2026, but the largest of them shrank. The mindset that includes Californians who had not yet formed a view fell from 30% of the state to 20%, and almost all of that movement went to the two most concerned groups, who together now make up 43% of California. A year of using AI made it harder to have no opinion about it, and the opinions people formed were not favorable. (Section 5)
One reason we trust these findings is that we found them twice. Across two large surveys, run a year apart with different questions and samples, the core results barely moved: the 70–21 split in favor of strong laws, the 60–22 belief that AI’s gains will flow to the wealthiest households and corporations, and the deep lack of trust in the companies building it. Where views did shift, they moved toward stronger state action. For legislators, that stability is the key finding. Across parties, regions, and levels of AI use, Californians do not need to be convinced that AI needs rules. What they are not yet sure of is whether the people they elect will make them, and make them in the public’s interest.
Throughout this report, descriptive findings are followed by sections marked “What this means.” These are our interpretation of the evidence rather than findings in themselves, and readers may reasonably draw different conclusions from the same evidence.
1.
AI went
mainstream
Over the last year, Californians have had far more opportunity to use AI for themselves: adoption has risen sharply, while familiarity has increased. People learned what these tools could do, where they fell short, and where they could work in their own lives.
79% of Californians have now used an AI program such as ChatGPT, Gemini, or Claude. 33% used one today or yesterday, 58% within the past week, while only 17% never have. Two-thirds (66%) describe themselves as very or somewhat familiar with AI. Daily or near-daily use peaks among people aged 25–44, at 42%, and among Asian (38%) and Black (36%) Californians. Meanwhile, 35% of seniors have never used AI, nor have 20% of women, compared with 14% of men.
Californians have also learned how to use these tools. On our nine-item literacy index, designed to test understanding beyond self-reported familiarity, the average Californian scored 61 out of 100. Most feel more confident making practical judgments than explaining the technology itself: 56% can name a case where AI should not be used, 54% say they disclose AI-made content, 52% check AI answers against another source, and 49% feel confident spotting AI-generated media. But only 30% can describe how a machine-learning model is trained, while 34% know what personal data an AI service stores.
In other words, Californians are gaining practical street-smarts about AI faster than technical knowledge of how these systems are built or how their effects may play out at scale. That does not mean they miss the wider social and cultural stakes, just that they are learning to judge AI first through how it enters their lives: as users and consumers. That distinction returns in Section 4.
Two findings tell us more about the kind of confidence Californians are developing. While 52% say they check AI answers against another source, 28% have already been misled by AI content that seemed real. Both can be true, but together they suggest that checking is closer to a good intention than a working habit, and that confidence about spotting AI content runs ahead of the ability to actually spot it.
Then there is the 30% who believe AI systems are largely honest and free from bias. That view is strongest not among those who know the technology best, but among those most keen on it: younger, more optimistic men. Trust in AI’s neutrality seems to track enthusiasm more than knowledge.
Taken together, the findings suggest that Californians are learning how to use AI faster than they are learning when to trust it.
Trust in AI to make important decisions has also risen, from 15% in 2025 to 23% today. This confidence rises with use, with 33% of daily users saying they would trust AI with an important decision, compared with 10% of those who have never used it. This is the one measure in the study that moves as the industry might hope: the more people use AI, the more they trust it. But the ceiling remains low. Even among daily users, two in three would not trust AI with an important decision about their lives.
In some respects, this was a great year for the industry. Use went mainstream, familiarity grew, and people became more trusting of what AI could do. Californians embraced the tools. But their faith in the project, and the people behind it, moved the other way. Nor is this concern confined to a fringe of people who reject or avoid AI. Among Californians concerned about how AI is being developed, 45% had used an AI tool in the past week. Only 25% of those concerned had never used one.
Familiarity does not produce consent. A year of hands-on experience left Californians more capable with AI, not more hopeful about it. Whatever else the AI companies achieved this year, they did not earn the benefit of the doubt. People keep coming back to the same questions: who gains, who gets a say, and who is accountable when things go wrong? They asked these questions last year, and are asking them even more sharply now.
2.
While use rose,
faith fell

2.1 Views of AI worsened even as use increased
Californians are twice as likely to feel concerned about AI’s future as excited, by 58% to 29%. That gap holds across every party and nearly every demographic group. These views are also intensely held at both ends, with 35% of all Californians saying they are strongly concerned and 18% strongly excited. Half the state (51%) says AI is moving too fast, compared with 29% who say the pace is about right and just 7% who say it is too slow.
This year, every measure of how Californians felt about AI moved in the same direction. Net excitement about its future fell 8 points from −21 to −29, net favorability fell from +14 to +6, and the share with an unfavorable view rose by five points. Each shift was modest, but together they tell a clear story: views of AI grew worse even as use rose and more people trusted it to make important decisions about their lives.
The gender gap also changed this year, but not in the way we expected. In 2025, men were almost evenly split between excitement and concern, at 45% to 44%, while women were far more concerned, at 65% to 22%. A year later, women’s views had barely moved, with 63% concerned and 22% excited. The shift came from men, whose views swung 16 points from net excited to net concerned, with 52% now concerned and 37% excited. The gender gap is narrowing because men are moving toward the view women already held.
2.2 Their concern is with AI leaders, not the tools
Ask Californians how they feel about the people and groups shaping AI, and the locus of their concern becomes clear. While AI as a concept remains mildly positive, at +6, “AI company executives” score −24, the worst result in the study. They rank below Elon Musk and Mark Zuckerberg, both at −18, and Republicans in the state legislature at −21.
To find out whether the AI label itself was driving that response, we ran a randomized experiment in which half the sample rated “technology company executives” and the other half rated “AI company executives”. The label “AI” cut net favorability by 15 points. Californians are not simply reacting to company executives in general. They are separating the tools, still mildly liked at +6, from the people leading them, who sit 30 points lower. For now, the industry’s political problem lies less with its product than with the people behind it.
AI company executives have no clear partisan base. Republicans rate technology company executives at +16 and Elon Musk at +41, yet rate AI company executives at −1. Independents are even more negative, at −35, below Democrats at −31. Nor is there a well-liked public figure who can make the industry’s case. Sam Altman is unknown to 61% of Californians; among everyone, 23% view him unfavorably. Peter Thiel is unknown to 63%, with 23% viewing him unfavorably as well, while 69% do not know enough about Marc Andreessen to have a view. Musk and Mark Zuckerberg are widely known, but both rate −18. Anyone speaking for the industry therefore begins either little known or already disliked.
OpenAI is much better known, but views of it depend heavily on use. Daily AI users rate it at +40, while people who have never used AI rate it at −54. The divide also appears within younger age groups: OpenAI rates −18 among 18–24-year-olds but +13 among those aged 25–34. Anthropic remains mildly positive at +4, though 54% cannot yet rate it, suggesting that much of its support rests on being less well known.
That wider divide also has a clear gender pattern, with men rating technology company executives at +1, compared with −17 among women, while Musk rates −6 among men and −29 among women. The gap extends to the concept of AI itself, which remains positive among men at +16 but falls to −4 among women.
One side of this argument has no one the public wants to hear from, because the people who speak for AI in California are either unknown or disliked, and independents rate them worst of all. The people Californians do trust are those who speak for the people who bear the risks, with labor unions the best-liked institution in the study. “AI executives” now means more than an industry. It has become shorthand for what Californians want kept in check.
2.3 Few expect to share in AI’s gains
Beyond the favorability ratings is a deeper story about where ordinary people believe the benefits will go. 60% say its benefits will flow to the wealthiest households and corporations, while just 22% say working people and the middle class will benefit. That is almost unchanged from 2025, when the split was 59% to 20%, and it cuts across party lines: Democrats break 66% to 19%, Independents 63% to 19%, and Republicans 50% to 30%.
That view sits within a wider belief about how wealth and power work in the US. 58% say wealthy Americans got ahead because they had more opportunities, compared with 30% who believe they worked harder. And 61% believe government can and should play a direct role in solving problems, including 65% of California Republicans. If you look at these together, this is strong ground for arguments about who gets AI’s gains, and weak ground for telling government to simply get out of the way.
Californians believe AI will help in some tangible ways, but doubt its gains will be widely shared. They expect it to drive innovation that solves real problems in their lives (+41 net), create economic growth (+17), and improve healthcare (+17). But they also expect it to harm jobs (−21), workers’ rights (−14), and individual freedom (−12), and to worsen income inequality (−15). Even Republicans, the group most optimistic about AI, are only four points more likely to say it will help jobs than harm them. Democrats and Independents are 30 points more likely to say it will harm jobs than help them. Californians expect AI to create wealth, but believe most of it will flow to those already at the top.
When Californians are asked what AI will actually do, the upbeat claims fare worst. Only 31% think it is likely to create new jobs and industries. More think it will take control of nuclear weapons, at 35%. Just 39% expect it to improve efficiency and productivity, the same share that expect AI to make life-and-death decisions in war.
Nor do people expect the gains to reach them personally. In no age group do more Californians expect AI to help them than harm them. Among 45–54-year-olds, the two are level; in every other age group, more people expect to be harmed than helped by at least six points. Past waves of technology were sold on the idea that new jobs would replace those lost. Californians do not believe that will happen this time.
We gave Californians a direct choice between two views: should the state “rein in the unchecked power of billionaires and corporations using AI”, or “encourage and support the businesses, engineers, and scientists driving AI”? By 51% to 34%, they chose to rein in that power. The result was the same whether the concern was framed as one about power and control over people’s lives or economic fairness and wealth built at workers’ expense. A year ago, around 40% chose the more permissive view; today, only 34% do. Support for reining in power held firm, while more people moved into “not sure”. Even among Republicans, opposition to the stronger stance roughly halved over the year.
2.4 Knowledge and use don’t soften the demand for rules
If the concern and anger stems from ignorance, you would expect them to melt as people used the tools and understood them better. They do not. Concern falls as AI literacy rises, from 77% in the lowest-literacy quintile to 39% in the highest, but the demand for rules does not fall with it: the highest-literacy quintile is the most likely of any literacy group to call state action important (78%), and even there, strong laws beat trusting companies two to one (66/31). The fear of being left behind barely moves across the whole literacy range.
People who use AI more are somewhat more willing to trust companies, but they still back strong rules. Among those who used AI that day, 66% chose strong laws, with only 26% inclined to let companies act freely, and back the requirement that a human, not an AI system alone, makes the final call when a worker is disciplined or fired by a net of 67 points. Among people who have never used AI, the split is even greater at 78% to 8%. Daily AI users are almost evenly split on whether tech firms have too much control: 43% want stronger limits, while 44% side with those driving AI. They are more likely to want limits when the concern is that tech fortunes are growing at the cost of jobs and wages.
Many would assume the biggest generational divide runs between young and old, but actually it sits within the under-45s. Half of 18–24-year-olds describe themselves as very familiar with AI, more than any other age group, yet they use it much less often than those just older than them: 56% used AI in the past week, compared with 70% of 25–34-year-olds and 69% of 35–44-year-olds. Their views are also far colder. They rate AI itself at −14, OpenAI at −18, and AI company executives at −40, while the two older groups rate AI at +19.
Across the full sample, people who have used AI more recently tend to feel warmer toward it, but 18–24-year-olds break that pattern. They report the highest familiarity, use the tools often, and still hold the coldest views of any group under 45. That makes them an important exception, but not evidence that using AI makes people more negative.
Notably though, their colder view does not seem to come from having had more bad experiences with AI. Reports of deepfakes, automated dead ends, and changes at work are broadly in line with those among 25–44-year-olds, although 18–24-year-olds are somewhat more likely to say AI-generated content has misled them. What sets them apart is that they feel they have less say and expect less benefit. They score just +12 on having a real say in how AI is used, compared with +30 among 25–34-year-olds and +16 among 35–44-year-olds. On whether AI will make life better for people like them, they score −16, compared with +12 and +8.
Yet that does not make them the most pro-regulation age group. 65% choose strong laws, broadly in line with the two groups above them and well below older Californians. They are also the least likely age group to say US leadership in AI matters when no reason is given. The better reading is that Gen Z feels close to the technology, but poorly served by the project around it.
Concern about AI may ease as people get used to the tools, but the demand for rules does not. In fact, it is strongest among the Californians who know AI best. Even daily users back strong laws by more than two to one, which suggests this support will not fade as use grows. Three groups stand out, for differing reasons. Men are moving toward concern across most ages and literacy levels: will that trend continue? Women have made up their minds: concern is holding firm and support for strong laws stands at four to one. The group to watch is younger adults. They know the technology best, are the coldest of any group under 45, and have not yet decided what should be done.
2.5 Our findings from 2025 held
Finding the same results twice, across different surveys and samples a year apart, suggests these views are now firmly held. Support for strong laws remained at 70%, unchanged from 2025. The belief that AI’s gains will flow to the wealthiest households and corporations held at 60%, against 59%. Views on wealth and opportunity barely moved, at 58% in both years, as did support for a direct government role, at 61% compared with 63%. Even the softer measure of self-reported familiarity was almost unchanged, at 66% against 64%.
The political baseline barely moved. Democrats in the state legislature held at +13, Republicans remained at −21, and Elon Musk sat at −18, compared with −21 in 2025. Gavin Newsom and labor unions moved in opposite directions: Newsom rose from −1 to +8, with particularly positive ratings among Hispanic (+14) and Black (+28) Californians, while unions fell from +41 to +31 but remained the best-liked institution we tested. On the closest comparison, technology company executives fell to roughly where Silicon Valley-coded executives sat last year, while the new “AI company executives” measure came in lower still, at −24.
Where views did change, they mostly moved toward stronger rules and away from the most upbeat claims about AI. Men’s optimism fell sharply while women’s skepticism held. Support for encouraging the people building AI fell by six to seven points, Republican opposition to reining in corporate power roughly halved, and support for strong laws among Independents rose from 60% to 72%, the largest partisan shift in the study. Support for the argument that America must lead on AI also fell by about six points, though these results have wider margins of error. Expectations about AI’s effects became less extreme in both directions: the strongest positive ratings fell by around ten points, while the most negative improved by six to nine. The broad pattern did not change; Californians were simply less breathless in either direction.
The starting point is clear and there’s nothing left to prove: 70% want strong laws, 60% think the gains will go to those at the top, and Californians do not trust the people who build AI and doubt that the watchdogs can stay free of their sway. A year of seeing AI break into our daily lives did not change these views, so they are likely to hold through 2027. The question is not whether California wants rules, but whether it gets them and whether people start seeing evidence that they’re working.
Taken together, Californians’ skepticism of the AI industry is broad, settled, and almost unchanged after a year. Yet only 5% rank the power of large tech companies among their top three issues. A view this strong does not disappear; it gets folded into the issues people already care about. So where does it show up?
3.
Where the
concern shows up

3.1 AI lands inside concerns about cost of living
Californians are focused above all on the cost of living. Asked to name the three issues elected leaders should prioritize, 68% chose inflation and rising prices, 43% housing affordability, 35% jobs and the economy, and 30% healthcare. Abortion followed at 15%, with threats to democracy at 14% and climate change at 12%. Only 5% chose the power of large tech companies.
Over the last year, that order has become even clearer. Inflation led in both surveys, housing rose from fourth to second, and threats to democracy fell from third to ninth. AI as an independent concept is not yet a major issue in its own right. Instead, Californians judge it through the issues already shaping their lives, especially costs, jobs, and fairness. As the campaign funding experiment in Section 4 shows, those concerns can quickly become political when the role of tech money is made clear.
Californians already link AI to the costs they feel most at home. 58% fear it will push up the price of basic needs such as housing and power, and 47% think that is likely or very likely to actually happen. 57% expect AI to use too much energy. They are also 21 points more likely to say it will cost jobs than create them. For Californians, the debate over data centers and power use is already a debate about household bills. Relatedly, the strongest fears are clear and close to day-to-day life. Californians both expect and fear fake photos and videos (69% likely, 67% concerned), police surveillance (61% likely, 59% concerned), loss of privacy (56% likely, 64% concerned), and too much energy use (57% likely, 58% concerned).
War, nuclear arms, and bioweapons sit apart. People are very concerned about these threats, but few believe that they will actually happen. Californians fear what AI could do at its worst, but the harms they sincerely expect are more common and much closer to home.
3.2 AI is giving familiar worries tangible shape
Early in the survey, before we mentioned AI at all, we asked how worried people were about four things they might face in daily life: being watched or tracked without their knowledge (73% concerned); companies using data people did not know they held to make decisions about them (65%); being unfairly denied a loan, a home, or a job, with no reason given and no right of appeal (62%); and being charged a different price because of their personal data (60%). We asked these questions first on purpose, so the AI questions that came next would not shape people’s answers. What we found was that the harms Californians fear from AI did not start with AI: few questions in the whole study drew more concern, and Hispanic and Black Californians were the most worried. AI did not create that concern, but it has given it a more visible form.
Beyond these more structural concerns, Californians are also encountering more immediate harms as businesses and organizations choose to put AI and automated systems into everyday interactions, often leaving people with no practical choice but to engage with them. 43% of Californians say they have been trapped in an automated system that would not let them reach a human, and 70% have either experienced it themselves or personally know someone who has. A different kind of harm has spread just as widely: more than a quarter (28%) say they have been misled by AI-generated content that seemed real, and a remarkable one in four say a non-consensual fake or sexual image has affected them or someone close to them; among those under 50, roughly one in three.
Across this data, there are three notable patterns. Being trapped in an automated system is the most widely shared harm, and the only one that becomes more common with age. 48% of seniors have experienced it personally, rising to 54% among women over 50, who also feel they have the least say over AI in the study. Fake and sexual images, by contrast, are closest to the young. Roughly one in three Californians under 50 have either been affected themselves or know someone close who has, while one in ten 18–24-year-olds say it happened to them personally. That helps explain why fake photos and videos rank first for both likelihood and concern. Unfair automated decisions are most often reported by Black Californians (18%) and 35–44-year-olds (19%), while harassment and impersonation are concentrated among those aged 18–34.
The clearest way to talk about AI in California is to start with harms people already know: being stuck in a system with no person to reach, being told no with no reason or way to appeal, or being charged a price set with their own data. These harms are part of the cost-of-living worries gripping the state, but the concern runs deeper than cost. The institutions making decisions about people’s lives have become harder to reach and harder to hold to account. The trend began before AI, but the way businesses and organizations have used it has proved the fear right and sped the trend up. If we tell one story, it should be the story of the human no one can reach. More Californians have faced that harm than any other we tested, and it is the only one that becomes more common with age. That is what people fear: when something goes wrong, there is no one on the other end.
3.3 Most Californians feel AI is built without them
Californians distrust the companies building AI, and most feel shut out of how it is being built, a view that holds in nearly every part of the state. 61% agree that AI is being built by people whose priorities differ from their own, a net margin of +50, while 52% say new technologies are designed without people like them in mind, a net +35. Nearly half, 47%, expect to be left behind. Yet Californians are far from resigned: ’nothing can change AI’s path’ draws the weakest agreement in the battery, a net of just +24, and a quarter reject it outright. People feel excluded, but not powerless, which creates a clear demand for political action.
When the results are split by gender and age, men under 50 are the only group who both feel they have some control over AI and expect it to improve their lives, scoring +42 on choosing whether AI is part of their lives and +18 on whether it will make life better. Women 50 and over sit at the opposite end on every measure, at −20 on having a real say, −25 on life getting better, and 70% concerned. Women under 50 also lean negative despite high familiarity, while men over 50 feel informed but shut out: they are the group most likely to say AI’s builders have different priorities from their own, though they retain some mild optimism. Even men under 50, the most optimistic group, agree by +45 that AI is being built by people whose priorities differ from theirs. The groups broadly agree on who is driving AI; what divides them is whether they expect to have any say in it or gain from it.
3.4 Outside the big cities, the gap is benefits, not fear
The sharpest geographic divide is over who expects to benefit, with net agreement that AI will make life better for people like them falling from +9 in large cities to −2 in the suburbs, −15 in smaller cities, −18 in small towns, and −23 in rural areas. The same pattern runs through AI’s main promised gains. 31% of large-city residents expect it to help them personally, compared with around 20% to 24% in small towns and rural areas. Expectations that AI will create jobs fall from 37% to 23%, while expectations of greater efficiency fall from 43% to 29%. Even healthcare, the most widely expected benefit statewide, drops from +25 in large cities to −1 in rural California. This is not simply a divide between urban and rural areas: smaller cities sit much closer to towns and rural communities than to Los Angeles or San Francisco.
Yet wherever you are, the expected harms are fairly consistent, with the number of people who think AI will harm them personally staying between 31% and 38% across all five areas and fear of being left behind remaining almost flat. The biggest geographic difference is whether or not people feel any sense of agency, with sharp drops from net +18 in large cities to −16 in rural California. AI is also believed to have already changed the work of 17% of large-city residents, compared with just 6% to 11% in small towns and rural areas. Outside the large cities, Californians do not necessarily expect more harm but they do see less evidence that AI’s benefits will reach them or that they will have a say in how it shapes their lives.
Where Californians live shapes what they expect from AI, but not the rules they want. In every kind of community, most people want strong laws and strongly back having a person make the final call. But a good result means different things in different places. Outside the big cities, promises that AI will pay off one day don’t mean much. People want to see benefits and a share of the gains now, a say in the systems that shape their lives, and someone to turn to when those systems get it wrong.
3.5 No one is trusted to police the AI decisions on the horizon
Californians expect AI to take over many high-stakes decisions long before they trust it to make them. Around half think that, within the next few years, AI rather than people will screen job applications (50%), approve loans (48%), and decide insurance coverage and claims (45%). Yet only 23% would trust AI to make an important decision about them, while 47% have little or no trust in it doing so. People can see automated decision-making coming, but they do not want to be left at its mercy.
Those who most expect AI to take over these decisions are also the most likely to demand a right to challenge them. Among Californians who think AI will make all or nearly all loan decisions, the requirement for an explanation and right of appeal wins by net +50, compared with +21 among those who expect AI to make few or none.
3.6 Californians want to know someone they trust is accountable
Californians want someone answerable to the public to take charge, even though they do not much trust either level of government to do it. Only 37% trust the California government to control AI and 30% trust the federal government, while 56% and 64% respectively do not trust them to act. Yet 67% say it is extremely or very important for California lawmakers to act on technology and AI, including 65% of Republicans. Across the state, most also believe it’s more likely that Sacramento will be able to act than Washington, by 53% to 45%.
This demand, however, is not built on faith in the state. Even among Californians who choose strong laws, only 36% trust Sacramento on AI, while 59% do not. Voters are not choosing a regulator they trust; they are demanding that someone accountable step in, and the state is the more trusted of the two. Democrats place more trust in Sacramento and little in Washington, while Republicans show the reverse. Even so, support for state action holds among Republicans, despite their placing more trust in Washington than in Sacramento to handle AI. Trust in both governments is also almost unchanged from a year ago.
Californians are also a politically active bunch, who aren’t just waiting for the state to act. 37% signed a petition in the past year, while the social platforms where these arguments play out reach most of the state each week.
However, the apparent stability in the statewide figures conceals significant movement underneath. Republicans warmed to both governments over the year, with their trust in Sacramento to handle AI rising from 30% to 40%, and in Washington from 38% to 48%, while Democrats went the other way on Washington, falling from 32% to 26%, and Independents edged up on both. The shifts largely cancel out in the statewide numbers, which is why the totals look untouched. The partisan gap beneath them widened: Republicans now trust Washington on AI by 22 points more than Democrats do, up from six points a year ago.
Californians are asking legislators to do a job they’re nervous they can’t be trusted with. Even among those who want strong laws, just 36% trust the state to deliver them; 59% do not. Californians have already made clear that they want rules. The test they’re holding legislators to is whether those rules take effect, work, and make a clear difference.
Californians can name the harms and want someone to act, even though they trust no one to do it. So what do they want done?
4.
What Californians
want done
4.1 Seven proposals, one verdict
We asked the full sample about seven policy proposals. Six were aimed at protecting the public; one would give companies more freedom. All six safeguards won by wide margins, while the more permissive measure lost.
The strongest support went to requiring a person, rather than an AI system acting alone, to make the final decision when a worker is disciplined or fired. The proposal received 75% support and 8% opposition, giving it net support of +67.
The next two strongest results also concerned the workplace. Requiring employers to consult workers before introducing AI monitoring had net support of +61, while requiring companies to report AI-driven job cuts came in at +60. Stopping big tech from blocking smaller rivals followed at +58, with a ban on prices based on personal data at +56. The narrowest margin was still +42, for giving people an explanation and a right of appeal when AI is used to make decisions about jobs, housing, or loans.
The only proposal offering companies more leeway would allow them to record private conversations for business reasons. It was rejected by 59% to 21%. Even among the one in eight Californians who feel very favorable toward AI, support and opposition were evenly split.
Requiring a person to make the final call on firing comes close to a consensus position in California. Net support is +67 overall, rising to +70 among Republicans and +82 among seniors. People aged 18 to 24 are the least supportive age group, but even among them the margin is +51.
This appears to be a consistent view, as in 2025, when Californians were asked more broadly about human oversight, 66% supported it before messaging and 71% afterwards. In 2026, 75% backed it without any prompt. Measures giving workers a voice and requiring transparency also do better than those focused on competition and pricing. Californians respond most strongly to practical protections as AI enters workplaces and everyday decisions.
Support is even stronger among people who have dealt with these systems themselves. 43% of Californians say they have been trapped by an automated system. Among them, the human final call wins by 87% to 5%. Support for strong laws stands at 77%, with 15% opposed.
People whose own work has changed because of AI show the same pattern. In this group, requiring companies to disclose AI-driven job cuts has net support of +70, compared with +60 statewide. Worker consultation reaches +69, against +61 statewide. Support for the explain-and-appeal requirement also rises, from +42 overall to +56 among people who have been stuck in automated systems.
Those with direct experience are the strongest supporters of safeguards.
The broader results follow the same pattern. Of the 30 comparisons between protective policies and lived harms, 28 are at or above the statewide result. The remaining two come from the smallest groups and fall within the margin of error. Every group tested rejects the sole proposal that would place fewer constraints on companies.
4.2 Support survives the opponents’ best arguments
Could these majorities disappear once people hear the other side? The survey design tests that directly. Five of the seven proposals were first presented as head-to-head choices: a protective policy against a more permissive alternative, with a reason supporting each side. Only afterwards did we ask whether respondents favored or opposed each policy “regardless of the arguments on each side”. The support figures above are therefore not first reactions; they come after Californians had considered both sides of five policy debates.
All five policies still won when tested against the strongest arguments for a more permissive approach: job-loss disclosure by +56, worker consultation by +54, explain-and-appeal by +51, limits on surveillance pricing by +48, and antitrust measures by +46. The two policies tested only directly include the strongest safeguard in the study, the human-final-call requirement at +67, and the industry-favored proposal, which was rejected by roughly three to one.
The two formats are not a pure persuasion test. They differ in wording, order, and response format, so they show sensitivity to how a question is framed rather than the effect of any single argument. Four policies held steady or improved when asked plainly. Explain-and-appeal moved the other way, with 67% choosing it in the argued comparison and 60% supporting it in the later direct question. That may reflect the policy becoming clearer when the stakes are explained, but the survey cannot tell us whether the supporting argument itself caused the difference.
The 2025 study foreshadowed these findings, where its strongest-testing message was around fair pricing: describing supermarket dynamic pricing as “AI-powered” made it less popular, while surge pricing during the LA fires was viewed as unacceptable under either label. In 2026, the ban on surveillance pricing wins by 69% to 12% and survives the head-to-head test at +48. The same pattern holds for oversight: support rose to 71% in the 2025 message test and remained at 75% in 2026, without any prompt. The path from message testing to settled policy opinion is consistent.
That support is also remarkably broad. Every protective proposal wins across parties and age groups, from +70 among Republicans for the human-final-call requirement to +50 for explain-and-appeal. The recording proposal fails among all groups, including Republicans, at −25. The geographic pattern is similar: even Orange County, a Republican-leaning part of the state, chooses strong laws by 77% to 11% and says state action on AI is important at 76%. These figures come from a smaller weighted sample (n=174) and should be read with a margin of roughly seven points, but they point in the same direction as the statewide results.
A single automated mistake can cost someone a job, a loan, or a home. That is why the policy measure most strongly supported in the study calls for a person to make the final decision in any of these high-stakes settings. It draws the largest majority, people feel strongly about it, and it wins support from every party. Californians who have already been on the wrong end of an automated decision back it most of all. Even those keenest on AI back every one of these safeguards.
4.3 Enthusiasm changes whose side Californians take, not which rules they want
In Section 2, we asked Californians to choose between reining in “the unchecked power of billionaires and corporations using AI” and backing “the businesses, engineers, and scientists driving AI”. The excited group, making up 29% of the state, sided with the builders by 58% to 35%, while the concerned group, making up 58% of the state, backed reining in that power by 63% to 23%. Support for reining big tech in is almost thirty points lower among the small excited group, reflecting their greater sympathy with those building the technology.
Yet that gap starts to close the moment the question shifts from whose side Californians are on to what they want done. Asked to choose between strong laws that force companies to make AI safe and trusting companies to innovate responsibly, the excited group backs strong laws by 59% to 36%, while the concerned group does so by 78% to 14%. They are still nineteen points apart, but now they are on the same side. The gap closes further on the basic question of whether California should act on AI at all, with 67% of the excited group saying state action is extremely or very important, against 72% of the concerned, a difference of just five points.
The divide all but disappears on the strongest safeguard we tested, which would require a person, rather than an AI system alone, to make the final decision before someone is fired: 73% of the excited group and 79% of the concerned group back it, while just 9% and 8% respectively oppose it. Only six points separate the two groups, and the wider pattern holds however we cut the data: daily users, people favorable to AI, people who think it will help working people, and even the small group who rate AI executives favorably all choose strong laws over trusting companies. Enthusiasm about AI shapes who Californians feel sympathetic toward as leaders, but barely touches the rules they want.
4.4 The American-leadership argument works, within limits
How much Californians care about American leadership in AI is highly sensitive to the frame used to explain why it matters. We tested this in a randomized experiment, where respondents were split into three groups. Each group was asked how important it was that the US develop advanced AI, with a different reason attached to each version. With no reason given, 38% rated it as important. That rose to 47% when framed as helping American workers and businesses, and to 48% when framed as keeping the US ahead of China.
Because each person only saw one version, the differences between the groups show the effect of the justification itself. Either argument adds around ten points of support.
That ten-point lift reveals something important about the argument for American leadership in AI. Most Californians do not expect to benefit personally from AI, indeed only 31% think it is likely to create new jobs and industries, just 25% expect it to improve their own lives, and 60% believe its gains will flow to the wealthiest households and corporations. A technology that people do not expect to benefit them needs a reason beyond personal gain. Both frames provide one: someone to help, or someone to beat. The external purpose fills the gap left by the missing personal benefit.
The two frames also reach different parts of the electorate. Independents respond more strongly to the worker frame, which adds 13 points compared with 7 for the China frame. Democrats show the reverse pattern, where mentioning China adds 11 points, while the worker frame adds 5. Republicans respond equally to both, with each adding 12 points. The biggest movement from the China frame comes among 18–24-year-olds, lifting support from 19%, the lowest score in the study, to 37%.
But the ceiling is lower than it was a year ago. We ran the same experiment in our May 2025 survey, and the China frame added the same ten points of support then as it does now. The difference is where each version starts. Without a reason attached, 44% of Californians said US AI development was important in May 2025, compared with 38% today. With the China frame, that rose from 54% then to 48% now.
These results have wider uncertainty than most of the report because the 2025 versions used half samples and the wording changed slightly between years. But both versions fell by the same six points, suggesting a broader decline rather than noise in one measure. The appeal to American leadership still works; it just persuades fewer Californians than it did a year ago.
4.5 Tech money now costs votes
Finally, there is the political cost of tech money, which we measured through a three-way randomized experiment. Respondents were randomly split into three groups, each told that a hypothetical state legislative candidate was funded by either “a small group of wealthy donors”, “large technology companies”, or “tech billionaires like Sam Altman and Peter Thiel”. Each person saw only one version. Because the groups were otherwise alike, any difference in their response can be traced to how the source of the money was described.
All three descriptions hurt the candidate, but the billionaire version hurt most. Describing the funding as coming from “a small group of wealthy donors” moved Californians against the candidate by a net −8, while “large technology companies” scored −7. The “tech billionaires like Sam Altman and Peter Thiel” version produced the largest penalty, at −11, and the strongest negative reaction, with 22% saying they would be much less likely to support the candidate, compared with 17% for wealthy donors and 16% for technology companies.
The reaction varies sharply by who is asked, and as we’ve seen elsewhere, the age pattern is not a simple young-versus-old divide. Describing a candidate as funded by tech billionaires makes 25–34-year-olds more likely to support them, at +12, and 35–44-year-olds also move positive, at +9. Every other age group moves against the candidate, most strongly seniors at −46. Even 18–24-year-olds lean negative, at −11, suggesting the appeal of tech money sits with young professional cohorts, not young people generally.
Across party lines, Independents respond most negatively, at −22. Republicans are the exception, remaining mildly positive toward tech-backed candidates across every version, with the strongest response when the funders are described as large technology companies (+19).
The statewide −11 reflects the broader divide running through California’s views on AI. Hearing that a candidate was funded by “tech billionaires like Sam Altman and Peter Thiel” made concerned Californians less likely to support that candidate, at a net −29, while excited Californians became more likely to support them, at +22. But the concerned outnumber the excited by two to one, 58% to 29%. The same description made Californians who choose strong laws less likely to support the candidate, at −23, while the smaller group that would trust companies to innovate responsibly became more likely to support them, at +24. The same source of funding signals different things to different Californians, with some seeing a warning and others seeing a credential.
This is not a cue that depends on everyone already following tech politics. 41% of Californians have heard at least a moderate amount about tech money in state politics, while only 5% name the power of large tech companies as a top-three issue. That suggests that although the issue may be latent, the political signal is still powerful when activated.
Tech money now buys the smaller side of a settled argument: the billionaire cue repels the concerned (net −29) and attracts the excited (net +22), and the repelled side is twice the size of the attracted side. 41% of the state is already primed to hear about it.
5.
Five mindsets,
one verdict

Every number so far has been a statewide average, but campaigns never meet an average voter. Since 2025, this research has mapped California another way, not by party, age, turnout, or region, but by how people think about AI, what they value and what they fear. The result is the California AI Compass, which groups the state into five distinct mindsets.
The same five mindsets emerged again in 2026, with the same basic characters and relative positions. What changed over the year was the size of each group and how people within them now understand AI. Because the mindsets are re-derived each year from new respondents, changes over time describe shifts in the groups rather than movement among the same individuals. The different survey panels also mean year-on-year shares should be read as directional rather than precise point estimates.
5.1 The same five mindsets came back
The five mindsets, resized by a year
Share of California adults in each AI Compass mindset, 2025 against 2026. Deltas are shown where the shift clears the report’s four-point noise band. The survey panel changed between waves, so read these as direction rather than decimals
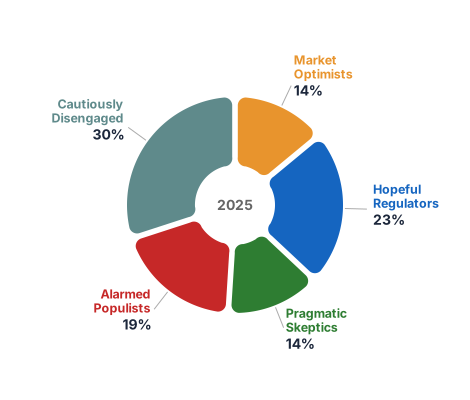
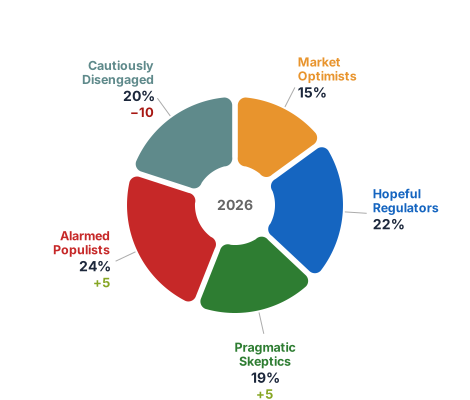
Figure 5.1
Market Optimists (15%) remain the group most aligned with the industry’s preferred story. They are male-skewed, the only mindset with more Republicans than Democrats, and the only group where more people say the wealthy succeeded through hard work rather than opportunity. They are excited about AI by 54% to 30%. But they are no longer the people who know the technology best. On the literacy index they average 64, behind Hopeful Regulators at 73. Their optimism appears to come less from insider knowledge and more from a broader belief that new technologies tend to work out.
Hopeful Regulators (22%) are the youngest and most engaged mindset. 84% use AI at least weekly, they have the highest literacy scores in the study, and half are raising children. They are also the most excited about AI (58%) and the most electorally reliable (77% likely voters). Their optimism extends across the actors shaping AI, with labor unions at +42 and AI company executives at +22. A year ago, this mindset looked like a Democratic group. In 2026, it is evenly split between Democrats and Republicans, with another fifth identifying as Independents.
Pragmatic Skeptics (19%) are the most female and most Democratic mindset, and they carry the clearest evidence of AI’s failures in their own lives. 66% have personally been trapped by an automated system that would not let them reach a human, the highest of any group in the study, and 43% have been misled by AI content that seemed real. Three in ten have never used an AI tool at all. Their views reflect that experience. Concern outweighs excitement by 91% to 4%, and they rate AI company executives at −70, with 57% very unfavorable.
Alarmed Populists (24%) are now the largest mindset in California. They are the oldest group in the state, with two in five Californians over 65 belonging to this group. They are majority-female and deeply skeptical that AI’s gains will be shared. Three in four believe those gains will flow to the wealthiest households and corporations. They are concerned about AI by 75% to 14%, but they are not disengaged. They sign petitions at above-average rates, and 70% identify as likely voters.
The Cautiously Disengaged (20%) are the state’s remaining bystanders. They are evenly split by gender, the least partisan, the least politically engaged, and the least familiar with AI of any mindset. Their defining response is uncertainty, with “not sure” consistently their most common answer. Even among this group, however, every protective proposal tested in Section 4 receives more support than opposition.
5.2 The disengaged middle broke toward concern
In 2025, the Cautiously Disengaged mindset, which is largely defined by people who didn’t really have a strong view on AI, represented 30% of the state, making it the largest Compass mindset. Yet in 2026, it has shrunk to only 20% as people start to develop firmer views on the technology. This shift, however, was not evenly distributed across the other groups. The two optimistic mindsets barely changed, while Pragmatic Skeptics grew from 14% to 19% and Alarmed Populists from 19% to 24%, together rising from a third of California to 43%.
The Compass reveals what sits underneath the statewide average, showing how different values and experiences of AI produce different views of the technology. As AI use becomes more common, staying neutral becomes harder to sustain, with 58% of Californians now reporting that they use AI weekly, while only 17% have never used it. While experience shapes opinion, it doesn’t necessarily determine its direction.
Among those who use AI frequently and believe in its potential, we often see optimism. Hopeful Regulators combine the highest literacy scores in the study with the most positive views of AI. Among those whose contact with AI has often been frustrating or unwanted, the same exposure produces a much more skeptical response. That is why Pragmatic Skeptics can be the least engaged with AI in practice and the strongest supporters of regulation at the same time.
Excitement also fell amongst the two mindsets that most believe in AI’s potential, with Market Optimists dropping from 72% to 54%, while among Hopeful Regulators excitement fell from 68% to 58%. Alarmed Populists moved slightly in the other direction, from 2% excited to 14%, not because their concerns disappeared but because the group itself grew. A mindset that now includes a quarter of the state cannot remain as uniform as it once was.
The youngest adults also did not move into the enthusiast groups in the way the broader adoption story might suggest. 18–24-year-olds are more likely to fall among the Cautiously Disengaged (27%) and Alarmed Populists (23%) than Hopeful Regulators (17%), a mindset otherwise made up largely of people only slightly older than them.
The 2025 study identified Pragmatic Skeptics and Alarmed Populists as the two most “shiftable and sympathetic” mindsets and argued there was an opportunity to unite them. A year later, they represent 43% of Californians, they remain committed to stronger regulation, and hold the strongest views in the study about it. Alarmed Populists are also now the largest mindset in the state.
The disengaged middle shrank; the alarmed blocs grew
Each band is one mindset and its width is that mindset’s share of the state. Bands connect a mindset to itself: mindsets are re-derived each wave, so this shows the blocs changing size, not individuals moving between them
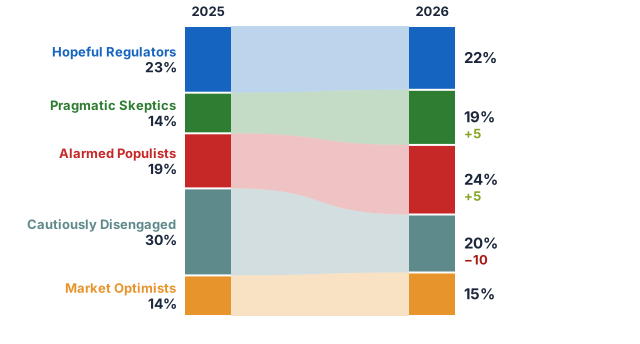
Figure 5.5
5.3 Washington changed who some Californians trust, but not what they want
Section 3.6 showed that trust in the federal government on AI barely moved statewide, from 32% to 30%, while masking a partisan shift underneath. Republicans became more trusting and Democrats less so. The Compass shows that same movement more sharply, with the biggest changes concentrated inside the groups most aligned with each side.
Among Republican-leaning Market Optimists, trust in Washington to control AI more than doubled, rising from 17% to 44%. Among Hopeful Regulators, it fell from 80% to 60%, while among Pragmatic Skeptics it collapsed from 44% to 8%. Alarmed Populists, who had almost no trust in government to begin with, rose only slightly from 3% to 16%.
A federal government perceived as closer to the AI industry became a partisan signal, and each mindset interpreted that signal through its own existing views. What did not change was the underlying verdict. Support for strong laws remained at 70% statewide, and among Pragmatic Skeptics, whose trust in Washington fell most sharply, it rose from 81% to 86%. Californians changed who they trusted to oversee AI. They did not change their belief that AI needs rules.
5.4 The Skeptics now out-populist the Populists
Pragmatic Skeptics show the central tension running through this report, with declining confidence in government alongside a stronger demand for government action on AI. Their support for a direct government role in solving problems fell from 67% to 54%, placing them alongside the Cautiously Disengaged at the bottom of the table, and only 20% trust Sacramento on AI, the lowest of any mindset.
Yet they express the strongest demand for action of any group in the study. 86% choose strong laws over trusting companies, 68% say state action on AI is extremely important, and no other mindset exceeds 42% in saying state action is extremely important. They support the human-final-call requirement by 90% to 3%, with 78% strongly in favor.
What looks like a contradiction on paper is the central finding of the report when seen through the experience of Pragmatic Skeptics. These are the Californians most likely to have encountered AI’s failures directly, with two-thirds reporting they have been trapped in an automated system without a human to reach, nearly a quarter report their data has been misused, and 43% have been misled by content that seemed real.
They are also more hostile toward the people leading AI than any other mindset, rating AI executives at −70 compared with −48 among Alarmed Populists, and Elon Musk at −58 compared with −41. They are the group most likely to say that wealthy Americans succeeded because they were given more opportunities rather than because they worked harder. Their demand for government action does not come from confidence in government. It comes from a belief that, without rules, no one else is accountable when these systems fail.
5.5 What the Compass is for
Most issue research sorts the public by the categories used to read elections: party, age, gender, turnout history, region, and the like. Those categories work well on issues that have been argued over for decades, where people often inherit a position along with the rest of their political identity. AI does not follow that pattern, because it arrived quickly, reaches people unevenly, and is still new enough that most Californians are working out what they think. On AI, people’s experience with the tools, what they think those tools can do, who they think is building them, what they believe those builders want, and the wider values and outlooks they bring from the rest of their lives all predict their views better than demographics alone do.
The Compass measures those experiences and values, and its five mindsets cut across the usual political lines. Alarmed Populists are the largest mindset in the state, including 27% of California’s Democrats, 18% of its Republicans, two in five Californians over 65, and nearly a quarter of those aged 18 to 24. Hopeful Regulators, the group most enthusiastic about AI and most supportive of action, include a third of all Republicans and a fifth of all Democrats. No mindset is confined to one party, one generation, or one part of the state. A retired Republican woman in the Central Valley and a Democratic man in his thirties in Los Angeles can fall into the same mindset because they hold much the same view of who AI is being built for and what should be done about it. A reading based only on party and age would place them in different groups.
Grouping Californians by mindset reveals far more agreement than the usual political mapping would predict, since none of the five mindsets favors leaving AI largely to companies. In every group, support for strong laws is higher than trust in companies, ranging from 86% among Pragmatic Skeptics to 57% among Market Optimists, while trust in companies never reaches 40%. Net support for requiring a person to make the final call is positive in all five mindsets, ranging from +86 to +36. The industry’s recording proposal loses in four of the five mindsets. Hopeful Regulators are the exception, at +12, although the human-final-call requirement reaches +60 in that group.
The main difference between the mindsets is not whether they want rules, but why they want them. The two most concerned mindsets, which together now make up 43% of the state, focus most on who holds power and how it can be held accountable. They give the strongest support to the human-final-call requirement, at 78% and 68%; are the most likely to vote, at 71% and 70%; and respond most negatively to a candidate funded by tech billionaires, at net −56 and −43. Hopeful Regulators come at it from the other direction. They form the state’s most AI-literate and politically engaged mindset, yet three quarters say it is important for lawmakers to act on AI. They are the only group where funding from tech billionaires makes a candidate more attractive, at +39. Market Optimists, whose outlook is closest to the industry’s view of AI, still choose strong laws by 57% to 33%. The Cautiously Disengaged answer “not sure” more often than any other group, but they back every protective proposal tested.
Californians disagree more about who they trust than about whether AI needs rules. The two groups most worried about AI, now 43% of the state, care most about who holds power and react most strongly when a candidate is funded by tech billionaires. People who feel hopeful about AI are more open to those building it, but they still want lawmakers to act. Three quarters of Hopeful Regulators say state action matters, and even Market Optimists back strong laws by 57% to 33%. The Cautiously Disengaged respond best to harms they can picture, such as being stuck in a system with no human to reach.
What unites them is simple: when a system makes a decision about someone’s life, someone should have to answer for it. They may trust different leaders and institutions, but they all want someone they can hold to account when things go wrong.
6.
Conclusion

Although four in five Californians now use AI, two years of results point to the same verdict: wider use has not earned the industry more trust. Across parties, places, levels of use, and the policies tested, Californians see both the gains and the risks and continue to back firm rules.
Beyond the large cities, people are less sure they will share in AI’s gains or have a say over how it shapes their lives. That sense of being left out feeds their anger and makes talk of American leadership ring hollow when workers do not share in the gains at home; leadership abroad cannot take the place of safeguards and equity at home.
Californians also have strong views about the risks, and many say they have already faced them: no human they can reach, a decision no one will explain, an employer watching through a machine, or a price set with their data. When an automated system gets it wrong, the cost can be a job, a loan, or a home. They want safeguards they can see and use: to know when AI is involved, get an explanation for its decisions, appeal the outcome, reach a human when something goes wrong, and see companies face consequences when they break the rules. Of all the policies tested, requiring a person to make the final call in the workplace draws the largest majority, wins support from every party, and is backed most strongly by those who have already had an automated system get it wrong.
Californians still doubt that Sacramento will follow through, and they fear the industry may have too much sway over the lawmakers meant to police this world-changing technology. Promises alone will not settle those doubts. They need to see safeguards passed and working in their lives. What happens this session will show whether lawmakers answer to the public or to the industry.
Methodology

This report draws mainly on a 2026 online survey of California adults. We use the May 2025 California AI Compass for selected comparisons over time. The survey directly measured attitudes and policy preferences. The AI Literacy Index and the five Compass mindsets were constructed from respondents’ answers.
Survey and sample
Diffusion and CPS Insights designed, fielded, and analyzed the study for TechEquity Collaborative, with Cint supplying the online sample. Between July 9 and 21, 2026, 3,164 California adults aged 18 and over completed the survey in English or Spanish.
The questionnaire covered AI use and literacy, expected benefits and harms, experiences with automated systems, policy preferences, political behavior, and demographics.
We weighted the data to U.S. Census benchmarks for California’s adult population. Age and gender were weighted together as an interlocked target. Race and ethnicity were then adjusted through iterative raking.
For comparison, the May 2025 survey included 1,401 California adults and was conducted by Diffusion with Lake Research Partners and Voss Strategy for TechEquity Collaborative. The two studies used separate samples rather than returning to the same respondents.
Reading the results
Unless otherwise stated, figures are weighted percentages. Net scores subtract a negative response from a positive one. For example, a favorability net subtracts unfavorable from favorable, while a likelihood net subtracts less likely from more likely.
The approximate margin of sampling error for the full 2026 sample is ±1.7 percentage points at the 95% confidence level. Margins are wider for subgroups and experiment arms.
We compare results with 2025 only when the wording and response formats are equivalent, and we treat small changes cautiously. Yet wording, question order, and differences between online panels can also affect the year-on-year results.
Randomized experiments
The questionnaire included three split-sample experiments. Chance determined which version of each question a respondent saw. The experiments tested different reasons for U.S. leadership in AI, two framings of corporate power and regulation, and different descriptions of a legislative candidate’s campaign funding.
Since assignment was random, the groups should otherwise be comparable. Differences between them estimate the effect of the wording, subject to the wider uncertainty associated with the smaller samples.
AI Literacy Index
Asking people how familiar they are with AI provides only a broad self-assessment. Polls that rely on this measure alone may overstate public understanding of a fast-moving subject that receives extensive media coverage. The AI Literacy Index goes further by combining nine questions about what people understand and how they use AI.
These cover conceptual knowledge and practical judgment. Respondents were asked about model training and data storage, whether they check AI outputs, whether they can identify AI-generated media, and whether they know when AI should not be used. Other questions covered prompts and settings, disclosure of AI-created content, understanding explanations of AI, and recognition of bias. Negatively worded questions are reverse-scored.
The answers are combined and rescaled from 0 to 100, with higher scores indicating greater reported literacy. We also divide respondents into five equally sized bands, from Lowest to Highest.
The index measures more than exposure or confidence alone, but it remains a self-assessment rather than an objective test. The index draws on Long and Magerko’s (2020) multi-domain framework for AI literacy and the self-reported familiarity measures used by Gillespie et al. (2023). First applied in the 2025 California AI Compass, it has since been used in the 2026 UK and California surveys, allowing us to test and refine the measure across three large studies.
AI Compass segmentation
The Compass groups people according to patterns in their answers to the attitudinal questions. These shared views about AI, trust, and regulation often cut across demographic and political categories.
For the 2026 analysis, CPS Insights applied the exploratory factor analysis and K-means clustering procedure used in May 2025. The resulting clusters were then matched to the 2025 segment profiles.
We kept the segment definitions and their main attitudinal characteristics consistent, but did not make their sizes match the 2025 proportions. This lets us compare the same mindset structure over time while allowing the share of Californians in each group to change.
The surveys used separate samples. Changes in segment size therefore describe a shift in the overall population pattern, not individual people moving between mindsets.